Matterport3D: Learning from RGB-D Data in Indoor Environments

Angel ChangAngela DaiThomas FunkhouserMaciej HalberMatthias NießnerManolis SavvaShuran SongAndy ZengYinda Zhang

article20173DV2,651 citations

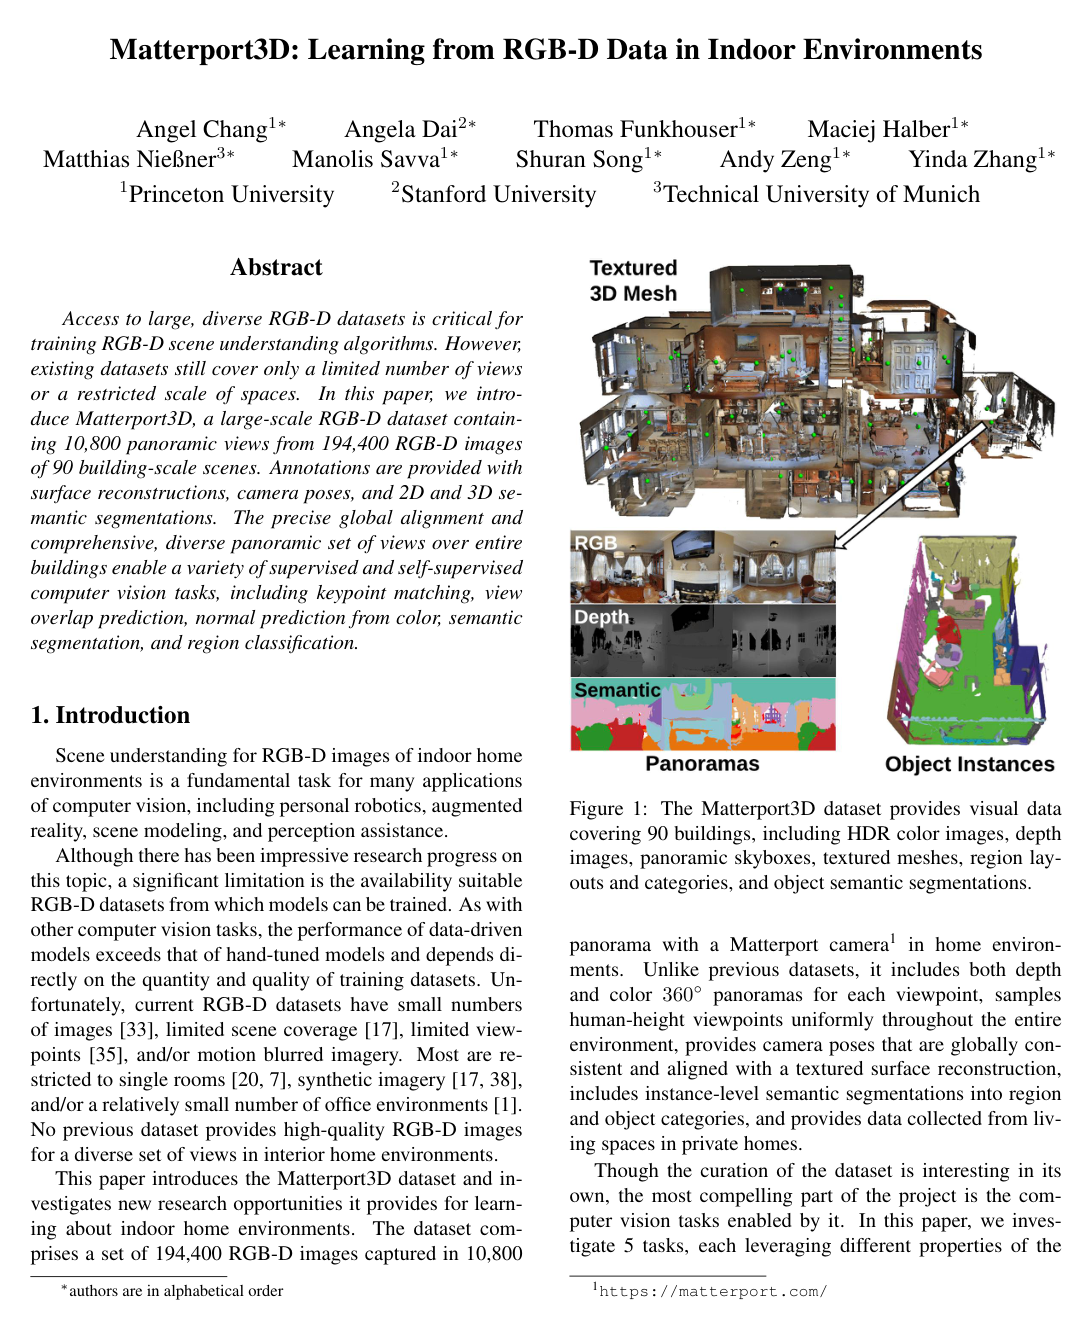
Presents Matterport3D, a large-scale indoor RGB-D dataset featuring 90 entire buildings with 10,800 panoramic views and comprehensive 2D and 3D semantic annotations to advance visual scene understanding across diverse computer vision tasks.

Listen

The article addresses the shortage of large, diverse RGB-D datasets for training algorithms that understand indoor scenes. This gap limits progress in applications such as robotics, augmented reality, and scene modeling, where current datasets are small, cover few viewpoints, or lack building-scale coverage.

The work introduces the Matterport3D dataset and evaluates its value for five computer vision tasks. Researchers captured 194,400 RGB-D images across 90 entire buildings, added global alignments, surface reconstructions, and instance-level semantic labels, then tested baseline models on keypoint matching, view-overlap prediction, surface-normal estimation, region classification, and semantic voxel labeling.

Pretraining on Matterport3D lowered keypoint matching error on SUN3D from 10.5 percent to 9.2 percent. Overlap prediction improved when models were trained on the new data and given an explicit regression loss. Normal estimation models pretrained on both synthetic scenes and Matterport3D achieved the lowest mean angular error of 20.89 degrees on NYUv2. Wider panoramic views raised region-classification accuracy for most room types, and semantic voxel labeling reached 70.3 percent overall accuracy on held-out buildings.

These results show that high-quality, globally aligned, multi-view RGB-D data from real homes yields more robust features and better generalization than prior datasets. The improvements directly support more reliable mapping, relocalization, and semantic understanding in consumer and industrial settings.

The dataset and code have been released publicly to enable further research. Additional work is needed to close remaining gaps in object categories with few examples and to test performance under wider lighting and clutter conditions. The main limitations are the absence of measured ground-truth camera poses and the concentration on residential rather than commercial spaces; results should be validated on new environments before critical deployment.

Cover for Matterport3D: Learning from RGB-D Data in Indoor Environments

Abstract

Access to large, diverse RGB-D datasets is critical for training RGB-D scene understanding algorithms. However, existing datasets still cover only a limited number of views or a restricted scale of spaces. In this paper, we introduce Matterport3D, a large-scale RGB-D dataset containing 10,800 panoramic views from 194,400 RGB-D images of 90 building-scale scenes. Annotations are provided with surface reconstructions, camera poses, and 2D and 3D semantic segmentations. The precise global alignment and comprehensive, diverse panoramic set of views over entire buildings enable a variety of supervised and self-supervised computer vision tasks, including keypoint matching, view overlap prediction, normal prediction from color, semantic segmentation, and region classification.

Table of Contents

  • 1 Introduction
  • 2 Background and Related Work
  • 3 The Matterport3D Dataset
  • 3.1 Data Acquisition Process
  • 3.2 Semantic Annotation
  • 3.3 Properties of the Dataset
  • 4 Learning from the Data
  • 4.1 Keypoint Matching
  • 4.2 View Overlap Prediction
  • 4.3 Surface Normal Estimation
  • 4.4 Region-Type Classification
  • 4.5 Semantic Voxel Labeling
  • 5 Conclusion
  • 6 Acknowledgements
  • References
  • A Learning from the Data
  • A.1 Keypoint Matching
  • A.2 View Overlap Prediction
  • A.3 Surface Normal Estimation
  • A.4 Region-Type Classification
  • A.5 Semantic Voxel Labeling

Knowls

  1. Knowl 1 — Matterport3D Dataset Specifications and Characteristics

    definition

    Matterport3D is a large-scale indoor RGB-D dataset spanning 90 entire building-scale environments (predominantly private residential homes, alongside offices and churches). The dataset comprises 10,800 panoramic viewpoints totaling 194,400 RGB-D images at 1280×10241280 \times 1024 resolution with high-dynamic-range (HDR) color, along with 24,727,52024,727,520 textured surface mesh triangles. In aggregate, the dataset spans 219,399m2219,399\,\text{m}^2 of surface area and 46,561m246,561\,\text{m}^2 of usable floor space distributed across 2,056 rooms (averaging 2.61 floors, 2,437.8m22,437.8\,\text{m}^2 of surface area, and 517.3m2517.3\,\text{m}^2 of floorspace per building).

    Key geometric and acquisition properties include:

    • Stationary Capture Rig: Data is captured via a tripod-mounted rig with three RGB and three depth cameras oriented at upward, horizontal, and downward pitch angles. The rig rotates around the gravity vector to 6 discrete yaw stops, producing 18 color and integrated depth frames per panorama center with approximately coincident projection centers covering roughly 3.75sr3.75\,\text{sr} of the viewing sphere.
    • Viewpoint Sampling Density: Panorama centers are uniformly spaced across walkable floor plans with mean spacing 2.25±0.57m2.25 \pm 0.57\,\text{m} (ensuring most walkable positions lie within 1.13m1.13\,\text{m} of a capture center). Each surface patch is observed by an average of 11 cameras (mode of 7), with a mean pixel observation depth of 2.125m2.125\,\text{m} (standard deviation 1.436m1.436\,\text{m}) and mean observation angle of 42.5842.58^\circ (standard deviation 15.5515.55^\circ).
    • Global Alignment: Poses are computed via global bundle adjustment across entire multi-floor buildings with an estimated surface point registration accuracy of 1cm\le 1\,\text{cm}.
    • Standard Split: The dataset is divided into 61 training buildings, 11 validation buildings, and 18 test buildings.
  2. Knowl 2 — Hierarchical 3D Semantic Annotation Pipeline

    model/method

    The semantic annotation pipeline for Matterport3D converts raw building meshes into structured room- and object-level semantic representations in three stages:

    1. Region Extent and Semantic Typing: Annotators specify 3D room boundaries by drawing 2D polygons on floor plans within an interactive tool. The system snaps the polygonal edges to detected planar wall and floor surfaces and extrudes them vertically to meet the ceiling mesh, assigning both a 3D bounding volume and a region category label (e.g., bedroom, kitchen, hallway).
    2. Crowdsourced Mesh Painting for Object Instances: Meshes within each extracted room volume are reconstructed via screened Poisson surface reconstruction. Annotators on Amazon Mechanical Turk (AMT) segment and label individual object instances by directly painting mesh triangles using an interactive 3D web interface, followed by validation and refinement by expert annotators.
    3. Category Canonicalization: Freeform crowd text annotations (yielding 1,659 unique raw text labels) are mapped to WordNet synsets, filtered by frequency, and grouped hierarchically (e.g., merging specific labels like 'office chair' and 'dining chair' into a common 'chair' class) to yield a canonical taxonomy of 40 object categories spanning 50,811 instance segmentations.
  3. Knowl 3 — Surface Visibility Overlap Metric for Loop Closure Detection

    equation

    Given two RGB-D image frames AA and BB, the surface visibility overlap overlap(A,B)[0,1]\text{overlap}(A, B) \in [0, 1] is formulated as a 3D intersection-over-union (IoU) metric:

    overlap(A,B)=min(A^,B^)A+Bmin(A^,B^)\text{overlap}(A, B) = \frac{\min(\hat{A}, \hat{B})}{|A| + |B| - \min(\hat{A}, \hat{B})}

    where A|A| and B|B| denote the total number of pixels with valid depth measurements in images AA and BB, respectively; A^\hat{A} is the number of valid pixels in AA whose back-projected 3D world coordinates fall within a Euclidean distance threshold of 5cm5\,\text{cm} from any back-projected 3D surface point of image BB; and B^\hat{B} is symmetrically the number of valid pixels in BB whose 3D reprojection lies within 5cm5\,\text{cm} of any back-projected point from image AA.

  4. Knowl 4 — Keypoint Descriptor Matching Evaluation on SUN3D Benchmark

    data/table

    A deep local keypoint descriptor is trained by feeding local image patches to a ResNet-50 backbone that outputs a 512-dimensional descriptor. The network is trained in a triplet Siamese configuration using an L2L_2 hinge embedding loss. Positive correspondences are generated from SIFT keypoint locations whose 3D world positions lie within 0.02m0.02\,\text{m} and whose surface normal orientations are within 100100^\circ. Evaluation is conducted on ground-truth correspondences from 8 held-out test scenes of the SUN3D dataset, measuring the false-positive rate (error percentage) at a fixed 95%95\% recall (lower error is better).

    Descriptor / Training Data Error (%) at 95% Recall
    SURF 46.8%
    SIFT 37.8%
    ResNet-50 w/ Matterport3D 10.6%
    ResNet-50 w/ SUN3D 10.5%
    ResNet-50 w/ Matterport3D + SUN3D 9.2%

    Pretraining the descriptor on wide-baseline correspondences from Matterport3D and fine-tuning on SUN3D achieves an error rate of 9.2%9.2\%, outperforming models trained exclusively on SUN3D (10.5%10.5\%) and hand-crafted features.

  5. Knowl 5 — View Overlap Prediction and Loop Closure Retrieval

    data/table

    Loop closure detection is formulated as an image retrieval task where a ResNet-50 model maps RGB frames to an embedding space where Euclidean distance correlates inversely with visual surface overlap. Models are trained using a triplet distance ratio loss alone or augmented with an auxiliary L2L_2 regression loss directly predicting the continuous overlap IoU value for pairs with overlap ratio >0.1> 0.1. Evaluation considers candidate pairs with physical camera separations >0.5m> 0.5\,\text{m}, measured by Normalized Discounted Cumulative Gain (NDCG, higher is better) against ground-truth overlap rankings.

    Training Set Testing Set Triplet NDCG Triplet + Regression NDCG
    Matterport3D SUN3D 74.41 81.97
    SUN3D SUN3D 79.91 83.34
    Matterport3D + SUN3D SUN3D 84.10 85.45
    Matterport3D Matterport3D 48.80 53.60

    Adding continuous overlap regression consistently improves retrieval performance across all benchmarks. Testing on Matterport3D yields substantially lower NDCG (53.6053.60) than SUN3D (85.4585.45), reflecting the increased difficulty of wide-baseline viewpoint variations compared to sequential handheld video trajectories.

  6. Knowl 6 — Surface Normal Estimation and Cross-Dataset Transfer

    data/table

    Surface normals are predicted from single RGB images using a fully convolutional neural network with a VGG-16 encoder and symmetric decoder with skip connections. Models are pretrained on synthetic data (SUNCG) and fine-tuned on real datasets (Matterport3D and NYUv2). Performance is quantified using per-pixel mean and median angular error in degrees (lower is better) and the percentage of pixels whose predicted normal angular error is within 11.2511.25^\circ, 22.522.5^\circ, and 3030^\circ (higher is better).

    Train Set 1 Train Set 2 Train Set 3 Mean (^\circ) \downarrow Median (^\circ) \downarrow 11.25% (^\circ) \uparrow 22.5% (^\circ) \uparrow 30% (^\circ) \uparrow
    SUNCG 28.18 21.75 26.45 51.34 62.92
    SUNCG NYUv2 22.07 14.79 39.61 65.63 75.25
    MP 31.23 25.95 18.17 43.61 56.69
    MP NYUv2 24.34 16.94 35.09 60.72 71.13
    SUNCG MP 26.34 21.08 23.04 53.36 67.45
    SUNCG MP NYUv2 20.89 13.79 42.29 67.82 77.16

    Cross-dataset evaluation between Matterport3D (MP) and NYUv2 demonstrates asymmetric generalization:

    Train Test Mean (^\circ) \downarrow Median (^\circ) \downarrow 11.25% (^\circ) \uparrow 22.5% (^\circ) \uparrow 30% (^\circ) \uparrow
    MP NYUv2 26.34 21.08 23.04 53.35 67.45
    NYUv2 NYUv2 22.07 14.79 39.61 65.63 75.25
    MP MP 19.11 10.44 52.33 72.22 79.46
    NYUv2 MP 33.91 25.07 23.98 46.26 56.45

    The model trained on Matterport3D transfers effectively to NYUv2 (26.3426.34^\circ mean), whereas the NYUv2-trained model exhibits severe degradation on Matterport3D (33.9133.91^\circ mean compared to 19.1119.11^\circ within-dataset), indicating that high-fidelity depth and viewpoint diversity in Matterport3D prevent overfitting to sensor artifacts.

  7. Knowl 7 — Effect of Field of View on Indoor Region-Type Classification

    data/table

    Indoor region (room-type) categorization evaluates a ResNet-50 model trained to classify the semantic room type containing the camera viewpoint across the 12 most frequent room categories in Matterport3D. The task compares classification using single perspective views versus full 360360^\circ panoramic skybox images.

    Input office lounge familyroom entryway dining room living room stairs kitchen porch bathroom bedroom hallway
    single 20.3 21.7 16.7 1.8 20.4 27.6 49.5 52.1 57.4 44.0 43.7 44.7
    pano 26.5 15.4 11.4 3.1 27.7 34.0 60.6 55.6 62.7 65.4 62.9 66.6

    Expanding the field of view from single views to 360360^\circ panoramas improves classification accuracy substantially for distinct, enclosed rooms that benefit from global layout context (e.g., bathroom +21.4%+21.4\%, bedroom +19.2%+19.2\%, hallway +21.9%+21.9\%, stairs +11.1%+11.1\%). However, performance drops in open-concept spaces (lounge 6.3%-6.3\%, family room 5.3%-5.3\%) because wide-angle panoramas capture visual features from adjacent interconnected rooms such as kitchens and hallways.

  8. Knowl 8 — 3D Semantic Voxel Labeling Benchmark on Matterport3D

    data/table

    Semantic voxel labeling predicts a semantic category for each occupied 3D voxel. Training scenes are voxelized into a regular grid with 2cm32\,\text{cm}^3 voxels and randomly sampled into subvolumes of size 1.5m×1.5m×3.0m1.5\,\text{m} \times 1.5\,\text{m} \times 3.0\,\text{m} (31×31×6231 \times 31 \times 62 voxels). Subvolumes are filtered to retain only those with 2%\ge 2\% voxel occupancy and 70%\ge 70\% valid semantic annotations, yielding 52,355 base training subvolumes augmented via 8 discrete rotations to 418,840 samples. A 3D convolutional network is evaluated across 20 object classes on the Matterport3D test set.

    Class % of Test Scenes Accuracy (%)
    Wall 28.9% 78.8%
    Floor 22.6% 92.6%
    Chair 2.7% 91.1%
    Door 5.0% 60.6%
    Table 1.7% 20.7%
    Picture 1.1% 28.4%
    Cabinet 2.9% 14.4%
    Window 2.2% 14.7%
    Sofa 0.1% 0.004%
    Bed 0.9% 1.0%
    Plant 2.0% 7.5%
    Sink 0.2% 23.8%
    Stairs 1.5% 54.0%
    Ceiling 8.1% 85.4%
    Toilet 0.1% 6.8%
    Mirror 0.4% 20.2%
    Bathtub 0.2% 5.1%
    Counter 0.4% 27.5%
    Railing 0.7% 18.3%
    Shelving 1.2% 16.6%
    Total 70.3%

    The model achieves an overall per-voxel classification accuracy of 70.3%70.3\%, with high performance on dominant structural categories (Floor 92.6%92.6\%, Chair 91.1%91.1\%, Ceiling 85.4%85.4\%, Wall 78.8%78.8\%) and low accuracy on rare or thin furniture categories (e.g., Sofa 0.004%0.004\%, Bed 1.0%1.0\%).

Coverage note — None omitted; all core contributions, dataset statistics, annotation workflows, mathematical formulations, and five benchmark tasks with their respective numerical results are fully captured.

References

  1. 1.I. Armeni, S. Sax, A. R. Zamir, and S. Savarese. Joint 2D-3D-semantic data for indoor scene understanding. arXiv preprint arXiv:1702.01105, 2017.
  2. 2.I. Armeni, O. Sener, A. R. Zamir, H. Jiang, I. Brilakis, M. Fischer, and S. Savarese. 3D semantic parsing of large-scale indoor spaces. In Proceedings of the IEEE Conference on Computer Vision and Pattern Recognition, pages 1534–1543, 2016.
  3. 3.A. Bansal, B. Russell, and A. Gupta. Marr revisited: 2D-3D alignment via surface normal prediction. In Proceedings of the IEEE Conference on Computer Vision and Pattern Recognition, pages 5965–5974, 2016.
  4. 4.S. Bell, K. Bala, and N. Snavely. Intrinsic images in the wild. ACM Trans. on Graphics (SIGGRAPH), 33(4), 2014.
  5. 5.S. Choi, Q.-Y. Zhou, S. Miller, and V. Koltun. A large dataset of object scans. arXiv preprint arXiv:1602.02481, 2016.
  6. 6.M. Chuang and M. Kazhdan. Interactive and anisotropic geometry processing using the screened poisson equation. ACM Transactions on Graphics (TOG), 30(4):57, 2011.
  7. 7.A. Dai, A. X. Chang, M. Savva, M. Halber, T. Funkhouser, and M. Nießner. Scannet: Richly-annotated 3d reconstructions of indoor scenes. http://arxiv.org/abs/1702.04405, 2017.
  8. 8.A. Dai, M. Nießner, M. Zollofer, S. Izadi, and C. Theobalt. Bundlefusion: Real-time globally consistent 3d reconstruction using on-the-fly surface re-integration. ACM Transactions on Graphics 2017 (TOG), 2017.
  9. 9.D. Eigen and R. Fergus. Predicting depth, surface normals and semantic labels with a common multi-scale convolutional architecture. In Proceedings of the IEEE International Conference on Computer Vision, pages 2650–2658, 2015.
  10. 10.M. Firman. RGBD datasets: Past, present and future. In CVPR Workshop on Large Scale 3D Data: Acquisition, Modelling and Analysis, 2016.
  11. 11.D. F. Fouhey, A. Gupta, and M. Hebert. Data-driven 3D primitives for single image understanding. In ICCV, 2013.
  12. 12.D. F. Fouhey, A. Gupta, and M. Hebert. Unfolding an indoor origami world. In European Conference on Computer Vision, pages 687–702. Springer, 2014.
  13. 13.S. Gupta, P. Arbelaez, and J. Malik. Perceptual organization and recognition of indoor scenes from RGB-D images. In Proceedings of the IEEE Conference on Computer Vision and Pattern Recognition, pages 564–571, 2013.
  14. 14.S. Gupta, R. Girshick, P. Arbelaez, and J. Malik. Learning rich features from RGB-D images for object detection and segmentation: Supplementary material, 2014.
  15. 15.M. Halber and T. Funkhouser. Structured global registration of rgb-d scans in indoor environments. 2017.
  16. 16.X. Han, T. Leung, Y. Jia, R. Sukthankar, and A. C. Berg. Matchnet: Unifying feature and metric learning for patch-based matching. In Proceedings of the IEEE Conference on Computer Vision and Pattern Recognition, pages 3279–3286, 2015.
  17. 17.A. Handa, V. Patraucean, V. Badrinarayanan, S. Stent, and R. Cipolla. SceneNet: Understanding real world indoor scenes with synthetic data. arXiv preprint arXiv:1511.07041, 2015.
  18. 18.K. He, X. Zhang, S. Ren, and J. Sun. Deep residual learning for image recognition. In Proceedings of the IEEE Conference on Computer Vision and Pattern Recognition, pages 770–778, 2016.
  19. 19.E. Hoffer, I. Hubara, and N. Ailon. Deep unsupervised learning through spatial contrasting. arXiv preprint arXiv:1610.00243, 2016.
  20. 20.B.-S. Hua, Q.-H. Pham, D. T. Nguyen, M.-K. Tran, L.-F. Yu, and S.-K. Yeung. SceneNN: A scene meshes dataset with annotations. In International Conference on 3D Vision (3DV), volume 1, 2016.
  21. 21.M. Kazhdan, M. Bolitho, and H. Hoppe. Poisson surface reconstruction. In Proceedings of the fourth Eurographics symposium on Geometry processing, volume 7, 2006.
  22. 22.A. Knapitsch, J. Park, Q.-Y. Zhou, and V. Koltun. Tanks and temples: Benchmarking large-scale scene reconstruction. ACM Transactions on Graphics, 36(4), 2017.
  23. 23.B. Li, C. Shen, Y. Dai, A. van den Hengel, and M. He. Depth and surface normal estimation from monocular images using regression on deep features and hierarchical CRFs. In Proceedings of the IEEE Conference on Computer Vision and Pattern Recognition, pages 1119–1127, 2015.
  24. 24.D. Lin, S. Fidler, and R. Urtasun. Holistic scene understanding for 3D object detection with rgbd cameras. In Proceedings of the IEEE International Conference on Computer Vision, pages 1417–1424, 2013.
  25. 25.M. Nießner, M. Zollhöfer, S. Izadi, and M. Stamminger. Real-time 3D reconstruction at scale using voxel hashing. ACM Transactions on Graphics (TOG), 2013.
  26. 26.K. Rematas, T. Ritschel, M. Fritz, E. Gavves, and T. Tuytelaars. Deep reflectance maps. In Proceedings of the IEEE Conference on Computer Vision and Pattern Recognition, pages 4508–4516, 2016.
  27. 27.X. Ren, L. Bo, and D. Fox. RGB-(D) scene labeling: Features and algorithms. In Computer Vision and Pattern Recognition (CVPR), 2012 IEEE Conference on, pages 2759–2766. IEEE, 2012.
  28. 28.M. Savva, A. X. Chang, P. Hanrahan, M. Fisher, and M. Nießner. PiGraphs: Learning Interaction Snapshots from Observations. ACM Transactions on Graphics (TOG), 35(4), 2016.
  29. 29.T. Schmidt, R. Newcombe, and D. Fox. Self-supervised visual descriptor learning for dense correspondence. IEEE Robotics and Automation Letters, 2(2):420–427, 2017.
  30. 30.J. Shotton, B. Glocker, C. Zach, S. Izadi, A. Criminisi, and A. Fitzgibbon. Scene coordinate regression forests for camera relocalization in RGB-D images. In Proceedings of the IEEE Conference on Computer Vision and Pattern Recognition, pages 2930–2937, 2013.
  31. 31.A. Shrivastava and A. Gupta. Building part-based object detectors via 3D geometry. In Proceedings of the IEEE International Conference on Computer Vision, pages 1745–1752, 2013.
  32. 32.N. Silberman and R. Fergus. Indoor scene segmentation using a structured light sensor. In Computer Vision Workshops (ICCV Workshops), 2011 IEEE International Conference on, 2011.
  33. 33.N. Silberman, D. Hoiem, P. Kohli, and R. Fergus. Indoor segmentation and support inference from RGBD images. In European Conference on Computer Vision, 2012.
  34. 34.E. Simo-Serra, E. Trulls, L. Ferraz, I. Kokkinos, P. Fua, and F. Moreno-Noguer. Discriminative learning of deep convolutional feature point descriptors. In Proceedings of the IEEE International Conference on Computer Vision, pages 118–126, 2015.
  35. 35.S. Song, S. P. Lichtenberg, and J. Xiao. SUN RGB-D: A RGB-D scene understanding benchmark suite. In Proceedings of the IEEE conference on computer vision and pattern recognition, pages 567–576, 2015.
  36. 36.S. Song and J. Xiao. Sliding shapes for 3D object detection in depth images. In European conference on computer vision, pages 634–651. Springer, 2014.
  37. 37.S. Song and J. Xiao. Deep sliding shapes for amodal 3D object detection in RGB-D images. 2016.
  38. 38.S. Song, F. Yu, A. Zeng, A. X. Chang, M. Savva, and T. Funkhouser. Semantic scene completion from a single depth image. arXiv preprint arXiv:1611.08974, 2016.
  39. 39.J. Valentin, A. Dai, M. Nießner, P. Kohli, P. Torr, S. Izadi, and C. Keskin. Learning to navigate the energy landscape. arXiv preprint arXiv:1603.05772, 2016.
  40. 40.J. Valentin, V. Vineet, M.-M. Cheng, D. Kim, J. Shotton, P. Kohli, M. Nießner, A. Criminisi, S. Izadi, and P. Torr. SemanticPaint: Interactive 3D labeling and learning at your fingertips. ACM Transactions on Graphics (TOG), 34(5):154, 2015.
  41. 41.X. Wang, D. Fouhey, and A. Gupta. Designing deep networks for surface normal estimation. In Proceedings of the IEEE Conference on Computer Vision and Pattern Recognition, pages 539–547, 2015.
  42. 42.J. Xiao, K. A. Ehinger, A. Oliva, and A. Torralba. Recognizing scene viewpoint using panoramic place representation. In Computer Vision and Pattern Recognition (CVPR), 2012 IEEE Conference on, pages 2695–2702. IEEE, 2012.
  43. 43.J. Xiao, J. Hays, K. A. Ehinger, A. Oliva, and A. Torralba. Sun database: Large-scale scene recognition from abbey to zoo. In Computer vision and pattern recognition (CVPR), 2010 IEEE conference on, pages 3485–3492. IEEE, 2010.
  44. 44.J. Xiao, A. Owens, and A. Torralba. SUN3D: A database of big spaces reconstructed using SFM and object labels. In Proceedings of the IEEE International Conference on Computer Vision, pages 1625–1632, 2013.
  45. 45.K. M. Yi, E. Trulls, V. Lepetit, and P. Fua. LIFT: Learned invariant feature transform. In European Conference on Computer Vision, pages 467–483. Springer, 2016.
  46. 46.A. Zeng, S. Song, M. Niessner, M. Fisher, J. Xiao, and T. Funkhouser. 3DMatch: Learning local geometric descriptors from RGB-D reconstructions. Proceedings of the IEEE Conference on Computer Vision and Pattern Recognition, 2017.
  47. 47.J. Zhang, C. Kan, A. G. Schwing, and R. Urtasun. Estimating the 3D layout of indoor scenes and its clutter from depth sensors. In Proceedings of the IEEE International Conference on Computer Vision, pages 1273–1280, 2013.
  48. 48.Y. Zhang, S. Song, E. Yumer, M. Savva, J.-Y. Lee, H. Jin, and T. Funkhouser. Physically-based rendering for indoor scene understanding using convolutional neural networks. arXiv preprint arXiv:1612.07429, 2016.
  49. 49.B. Zhou, A. Lapedriza, J. Xiao, A. Torralba, and A. Oliva. Learning deep features for scene recognition using places database. In Advances in neural information processing systems, pages 487–495, 2014.

Citation

MLA
Chang, A., et al. “Matterport3D: Learning from RGB-D Data in Indoor Environments”. 2017 International Conference on 3D Vision (3DV), 2017, pp. 667–76, https://doi.org/10.1109/3DV.2017.00081.
APA
Chang, A., Dai, A., Funkhouser, T., Halber, M., Niebner, M., Savva, M., Song, S., Zeng, A., & Zhang, Y. (2017). Matterport3D: Learning from RGB-D Data in Indoor Environments. 2017 International Conference on 3D Vision (3DV), 667–676. https://doi.org/10.1109/3DV.2017.00081
Chicago
Chang, A., A. Dai, T. Funkhouser, et al. 2017. “Matterport3D: Learning from RGB-D Data in Indoor Environments”. 2017 International Conference on 3D Vision (3DV), 667–76. https://doi.org/10.1109/3DV.2017.00081.
Harvard
Chang, A. et al. (2017) “Matterport3D: Learning from RGB-D Data in Indoor Environments”, 2017 International Conference on 3D Vision (3DV). IEEE, pp. 667–676. Available at: https://doi.org/10.1109/3DV.2017.00081.
Vancouver
1. Chang A, Dai A, Funkhouser T, Halber M, Niebner M, Savva M, Song S, Zeng A, Zhang Y (2017) Matterport3D: Learning from RGB-D Data in Indoor Environments. In: 2017 International Conference on 3D Vision (3DV). IEEE, pp 667–676

BibTeX

@inproceedings{Chang_2017, title={Matterport3D: Learning from RGB-D Data in Indoor Environments}, url={http://dx.doi.org/10.1109/3DV.2017.00081}, DOI={10.1109/3dv.2017.00081}, booktitle={2017 International Conference on 3D Vision (3DV)}, publisher={IEEE}, author={Chang, Angel and Dai, Angela and Funkhouser, Thomas and Halber, Maciej and Niebner, Matthias and Savva, Manolis and Song, Shuran and Zeng, Andy and Zhang, Yinda}, year={2017}, month=Oct, pages={667–676} }
Metadata:Crossref

Source Code

This paper has an official code repository available. Click below to access the source code.

View Repository

Access the Paper

This paper is available from its original source. Click below to access the PDF.

Open PDF