EuroSAT: A Novel Dataset and Deep Learning Benchmark for Land Use and Land Cover Classification

Patrick HelberBenjamin BischkeAndreas DengelDamian Borth

article2017IEEE JSTARS2,909 citations

Introduces EuroSAT, a public benchmark of 27,000 geo-referenced Sentinel-2 satellite images spanning 13 spectral bands to advance deep learning methods for land use classification and Earth observation mapping.

Listen

The EuroSAT paper introduces a new openly available dataset of 27,000 labeled 64-by-64 pixel Sentinel-2 image patches spanning ten land-use and land-cover classes across Europe. The work responds to the growing availability of free, frequent Sentinel-2 observations and the absence of large, multi-spectral training resources suited to real-world earth-observation tasks such as agriculture monitoring, urban change detection, and map maintenance.

The authors set out to produce a geo-referenced, 13-band dataset that matches the spatial and spectral characteristics of Sentinel-2 and to establish baseline classification performance with modern convolutional networks. They acquired cloud-free scenes over 34 European countries, extracted patches aligned with the European Urban Atlas, performed repeated manual quality checks, and released both RGB and full multi-spectral versions.

Benchmarks were obtained by fine-tuning ResNet-50 and GoogleNet models on an 80/20 class-wise split. The best model reached 98.57 percent overall accuracy on RGB imagery. Among the 13 spectral bands, the visible channels performed strongest, yet the red-edge and short-wave-infrared bands delivered competitive single-band results. Band-combination experiments showed that RGB outperformed both color-infrared and short-wave-infrared composites. The same models also surpassed prior published results on four established remote-sensing datasets by 2–4 percentage points.

These accuracy levels make automated, continent-scale monitoring practical. The trained classifier can flag land-cover changes between repeat Sentinel-2 acquisitions and can verify or extend crowdsourced maps such as OpenStreetMap. Because the underlying imagery remains free and will continue for at least two decades, the dataset removes a key barrier to operational use in agriculture, disaster response, and environmental policy.

The primary limitations are the European geographic scope, the fixed 10 m resolution, and the modest number of classes chosen for separability at that scale. Performance on imagery from other continents or under heavier cloud or snow conditions therefore remains untested. Nevertheless, the reported results rest on transparent splits, multiple architectures, and careful ground-truth curation, giving high confidence in the stated accuracy for the conditions examined.

Cover for EuroSAT: A Novel Dataset and Deep Learning Benchmark for Land Use and Land Cover Classification

Abstract

In this paper, we address the challenge of land use and land cover classification using Sentinel-2 satellite images. The Sentinel-2 satellite images are openly and freely accessible provided in the Earth observation program Copernicus. We present a novel dataset based on Sentinel-2 satellite images covering 13 spectral bands and consisting out of 10 classes with in total 27,000 labeled and geo-referenced images. We provide benchmarks for this novel dataset with its spectral bands using state-of-the-art deep Convolutional Neural Network (CNNs). With the proposed novel dataset, we achieved an overall classification accuracy of 98.57%. The resulting classification system opens a gate towards a number of Earth observation applications. We demonstrate how this classification system can be used for detecting land use and land cover changes and how it can assist in improving geographical maps. The geo-referenced dataset EuroSAT is made publicly available at this https URL.

Table of Contents

  • I Introduction
  • II Related Work
  • II-A Classification Datasets
  • II-B Land Use and Land Cover Classification
  • III Dataset Acquisition
  • III-A Satellite Image Acquisition
  • III-B Dataset Creation
  • IV Dataset Benchmarking
  • IV-A Comparative Evaluation
  • IV-B Band Evaluation
  • V Applications
  • V-A Land Use and Land Cover Change Detection
  • V-B Assistance in Mapping
  • VI Conclusion
  • References

Knowls

  1. Knowl 1 — EuroSAT Dataset Specification

    definition

    The EuroSAT dataset is a public, geo-referenced, patch-based land use and land cover (LULC) classification benchmark derived from Sentinel-2A satellite imagery. Key specifications include:

    • Image Count and Dimensions: 27,000 manually verified image patches, each measuring 64×6464 \times 64 pixels.
    • Classes: 10 land use and land cover classes, containing between 2,000 and 3,000 images per class:
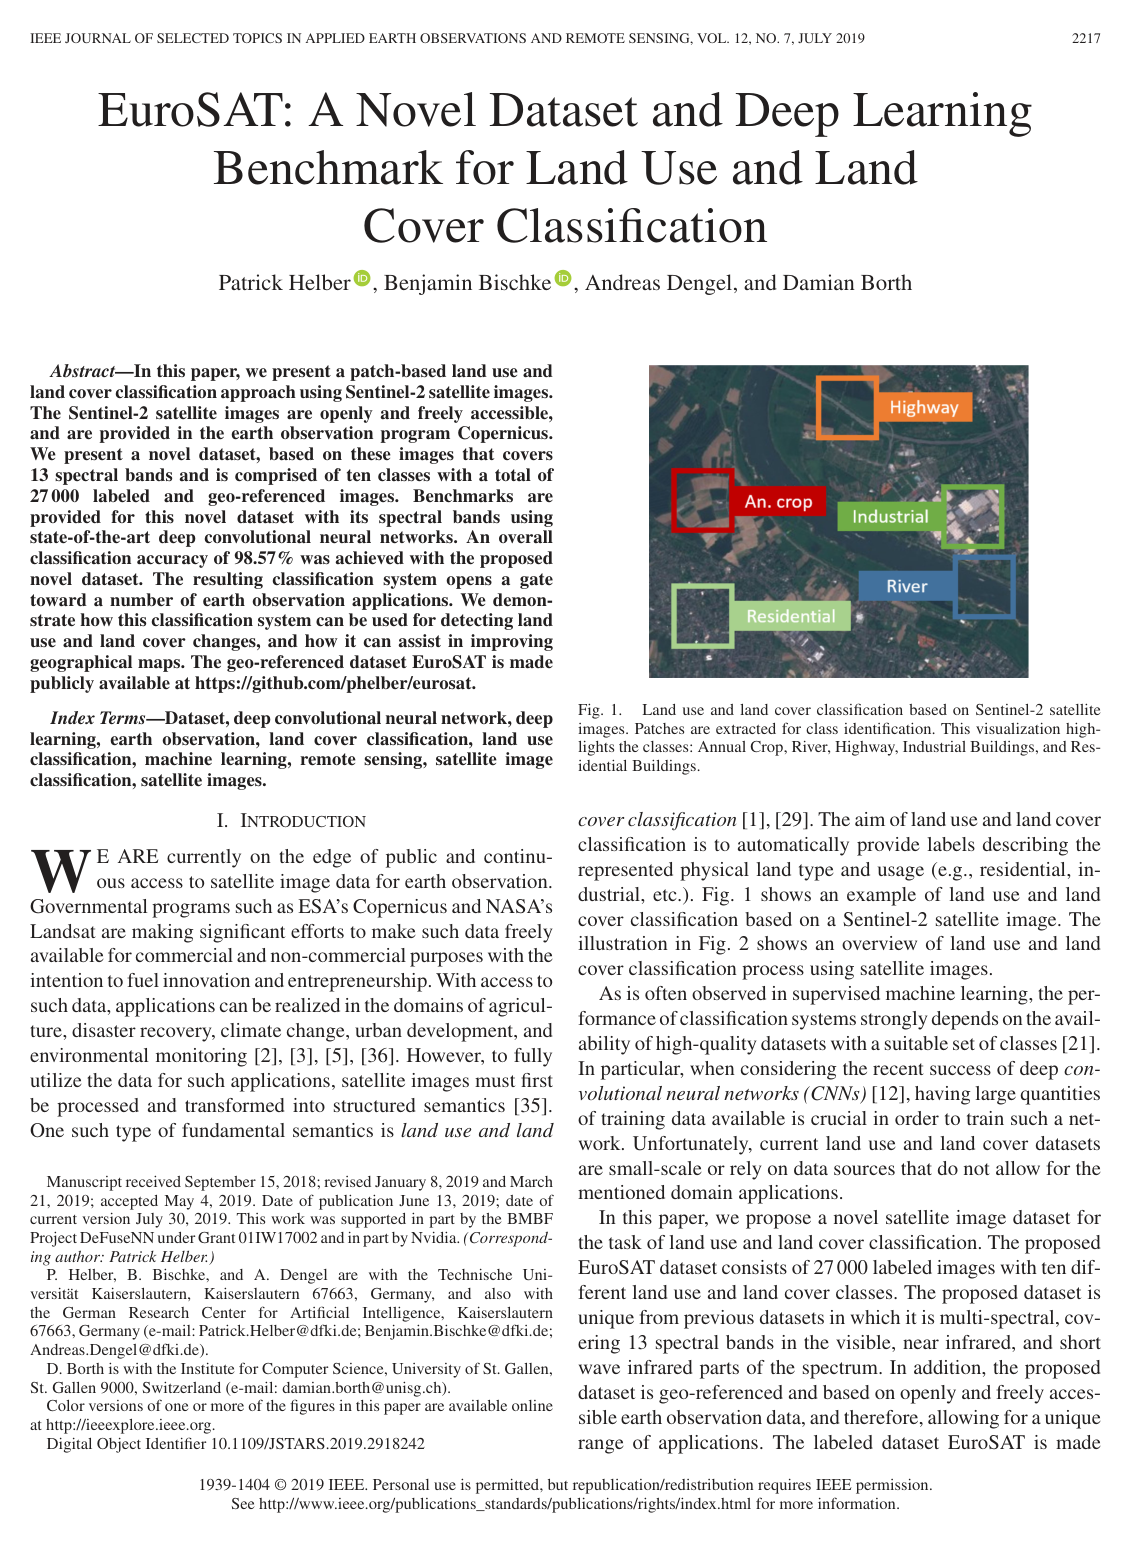
      1. Annual Crop
      2. Permanent Crop (e.g., vineyards, fruit orchards, olive groves)
      3. Pastures
      4. Highway
      5. Residential Buildings
      6. Industrial Buildings
      7. River
      8. Sea & Lake
      9. Forest
      10. Herbaceous Vegetation
    • Spectral Coverage: 13 multispectral bands spanning the visible, near-infrared (NIR), and shortwave-infrared (SWIR) spectra, provided in both multi-spectral (MS) and RGB formats.
    • Spatial Resolution: Resampled to a uniform 10 m/pixel resolution using cubic-spline interpolation for bands natively captured at lower resolutions (20 m and 60 m).
    • Geographic Coverage: Distributed across European cities in 34 countries based on the European Urban Atlas.
    • Data Formatting and Radiometry: Original 16-bit reflectance values are converted to 8-bit integers by mapping raw pixel values in the range [0,2750][0, 2750] into [1,255][1, 255] (with 00 designating no-data pixels). Atmospheric correction is intentionally omitted to preserve realistic sensor conditions.
  2. Knowl 2 — Sentinel-2 MSI Spectral Band Characteristics in EuroSAT

    data/table

    The EuroSAT dataset incorporates all 13 spectral bands collected by the Sentinel-2 Multispectral Imager (MSI). Three bands (B01, B09, B10) target atmospheric calibration (aerosols, water vapor, and cirrus detection), while the remaining ten bands primarily support land use and land cover classification.

    Band Band Name Spatial Resolution (m) Central Wavelength (nm)
    B01 Aerosols 60 443
    B02 Blue 10 490
    B03 Green 10 560
    B04 Red 10 665
    B05 Red edge 1 20 705
    B06 Red edge 2 20 740
    B07 Red edge 3 20 783
    B08 NIR 10 842
    B08A Red edge 4 20 865
    B09 Water vapor 60 945
    B10 Cirrus 60 1375
    B11 SWIR 1 20 1610
    B12 SWIR 2 20 2190

    Bands with native spatial resolutions of 20 m and 60 m are upsampled to 10 m/pixel using cubic-spline interpolation when evaluating model inputs.

  3. Knowl 3 — Deep Learning Benchmark Setup and Training Protocol

    experimental setup

    The benchmark protocol on the EuroSAT dataset evaluates standard classification architectures under controlled hyperparameters and data augmentation:

    • Input Preprocessing: Image patches are interpolated and resized from 64×6464 \times 64 to 224×224224 \times 224 pixels.
    • Data Augmentation: Training samples undergo random horizontal flipping, random shearing with a range factor of 0.20.2, and random zooming with a range factor of 0.20.2.
    • Optimization and Hyperparameters:
      • Optimizer: Stochastic Gradient Descent (SGD) with Nesterov momentum μ=0.9\mu = 0.9
      • Initial learning rate: η0=10−3\eta_0 = 10^{-3}
      • Weight decay: 10−610^{-6}
      • Mini-batch size: 16
      • Maximum training epochs: 120
      • Loss function: Categorical Cross-Entropy
      • Learning rate schedule: Decreased by a factor of 10 whenever validation loss plateaus for 5 consecutive epochs.
    • Fine-Tuning Procedure: For networks pretrained on the ILSVRC-2012 (ImageNet) dataset (ResNet-50 and GoogleNet), the newly added classification head is first trained in isolation with a learning rate of 0.010.01. Subsequently, all network layers are fine-tuned end-to-end with learning rates between 10−310^{-3} and 10−410^{-4}.
    • Baseline Shallow CNN Architecture: A three-layer convolutional neural network consisting of three successive blocks—each containing a 3×33 \times 3 convolution (stride 1, ReLU activation) followed by a 4×44 \times 4 max-pooling layer (stride 2)—concluding with a fully connected layer.
  4. Knowl 4 — Classification Accuracy on EuroSAT Across Architectures and Splits

    data/table

    Land use and land cover classification accuracy (%) on the EuroSAT RGB dataset across different training/test splits and model families (trained from scratch unless otherwise noted). Baseline methods include Bag-of-Visual-Words (BoVW) with SIFT features and an SVM classifier (codebook sizes k∈{10,100,500}k \in \{10, 100, 500\}), a 3-layer CNN, ResNet-50, and GoogleNet.

    Method 10/90 20/80 30/70 40/60 50/50 60/40 70/30 80/20 90/10
    BoVW (SVM, SIFT, k=10k=10) 54.54 56.13 56.77 57.06 57.22 57.47 57.71 58.55 58.44
    BoVW (SVM, SIFT, k=100k=100) 63.07 64.80 65.50 66.16 66.25 66.34 66.50 67.22 66.18
    BoVW (SVM, SIFT, k=500k=500) 65.62 67.26 68.01 68.52 68.61 68.74 69.07 70.05 69.54
    CNN (3 layers) 79.65 87.24 88.75 90.74 92.48 92.62 92.34 92.61 93.62
    ResNet-50 87.36 90.00 92.35 93.70 94.41 95.26 96.30 95.43 96.37
    GoogleNet 87.42 90.97 92.17 93.26 94.85 95.54 96.69 96.60 96.17

    Deep CNN models consistently outperform handcrafted BoVW representations across all data regimes, with deep architectures achieving over 96% accuracy even when trained from scratch.

  5. Knowl 5 — Benchmark Comparison of Fine-Tuned Deep CNNs on Satellite Datasets

    data/table

    Classification accuracy (%) of ImageNet-pretrained ResNet-50 and GoogleNet models on EuroSAT compared to four established aerial and satellite benchmark datasets (UC Merced [UCM], AID, SAT-6, and Brazilian Coffee Scene [BCS]) using an 80/20 class-wise train/test split:

    Method UCM AID SAT-6 BCS EuroSAT
    ResNet-50 96.42 94.38 99.56 93.57 98.57
    GoogleNet 97.32 93.99 98.29 92.70 98.18

    Fine-tuning ResNet-50 on EuroSAT achieves 98.57% overall accuracy, yielding an improvement of approximately 2% over the same network trained from scratch.

  6. Knowl 6 — Classification Accuracy of Spectral Band Combinations on EuroSAT

    data/table

    Classification accuracy (%) of an ImageNet fine-tuned ResNet-50 model on the EuroSAT dataset using different three-band multispectral composite inputs under an 80/20 train/test split:

    Band Combination Accuracy (%)
    Color-Infrared (CI) 98.30
    RGB 98.57
    Shortwave-Infrared (SWIR) 97.05

    Composite multi-band inputs consistently achieve higher classification performance than individual single-band inputs, with the RGB composite achieving the highest overall accuracy.

  7. Knowl 7 — Single-Band Classification Performance of Sentinel-2 MSI Bands

    empirical result

    When evaluating the classification performance of individual Sentinel-2 spectral bands using a fine-tuned ResNet-50 network (where a single band's data is duplicated across all three input channels):

    • Visible Bands: The visible spectrum bands—Red (B04), Green (B03), and Blue (B02)—achieve the highest individual classification accuracies, each reaching approximately 95%–97%.
    • Red Edge and SWIR vs. NIR: Red Edge 1 (B05) and Shortwave-Infrared 2 (B12), despite having an original spatial resolution of 20 m/pixel (upsampled to 10 m/pixel), achieve higher accuracy than the Near-Infrared band (B08), which has a native spatial resolution of 10 m/pixel.
    • Atmospheric Bands: The three atmospheric correction bands (B01 Aerosols, B09 Water Vapor, B10 Cirrus) show the lowest individual classification utility, with B10 (Cirrus) yielding the lowest accuracy at approximately 23%.
  8. Knowl 8 — Classification Accuracy of Baseline Models on UCM, AID, SAT-6, and BCS Datasets

    data/table

    Classification performance (%) of a 3-layer shallow CNN, ResNet-50, and GoogleNet across varying training/test split ratios on four standard remote sensing datasets:

    Dataset Method 10/90 20/80 30/70 40/60 50/50 60/40 70/30 80/20 90/10
    UCM CNN (3 layers) 36.45 49.58 64.62 69.60 70.76 76.78 76.83 81.43 82.38
    ResNet-50 40.63 50.89 65.51 72.51 75.61 84.40 84.33 84.76 90.00
    GoogleNet 45.39 60.95 70.34 77.38 82.47 85.60 88.88 91.43 93.80
    AID CNN (3 layers) 50.31 60.61 65.91 70.21 69.36 73.85 74.85 76.35 78.70
    ResNet-50 47.87 60.22 61.14 62.08 67.42 79.48 73.26 77.95 83.70
    GoogleNet 54.18 63.26 75.44 76.66 79.02 83.28 83.07 84.95 87.10
    SAT-6 CNN (3 layers) 95.32 97.03 97.62 98.49 98.72 98.83 99.25 99.13 99.11
    ResNet-50 96.23 96.67 96.84 98.96 98.44 98.05 98.12 98.61 99.35
    GoogleNet 96.75 97.01 97.15 98.12 98.68 98.95 99.29 99.21 99.18
    BCS CNN (3 layers) 83.08 85.23 86.09 86.67 87.41 86.45 88.31 88.54 89.33
    ResNet-50 82.12 85.02 87.88 89.51 89.46 88.62 91.32 90.10 89.23
    GoogleNet 83.05 85.19 87.48 88.29 89.51 88.54 90.85 89.40 89.32

    Shallow CNN architectures suffice to achieve near-ceiling accuracy on SAT-6 (>99%) and BCS (~89%), while deep architectures (GoogleNet and ResNet-50) provide substantial accuracy gains on datasets with higher intra-class complexity, such as UCM and AID.

  9. Knowl 9 — Patch-Based LULC Change Detection and Map Validation Method

    model/method

    The trained patch-based CNN classifier can be applied directly to temporal satellite monitoring and geographic map verification:

    • Temporal Change Detection: For a fixed geographic coordinate area corresponding to a 64×6464 \times 64 patch, images acquired at distinct points in time t1t_1 and t2t_2 are passed through the classifier. A land use/cover change is identified if the predicted class label changes between t1t_1 and t2t_2. This detects events such as industrial building demolition, urban/residential construction, and forest clearing/deforestation.
    • Crowdsourced Map Verification and Updating: In a sliding-window manner across satellite scenes, the classifier generates predicted land category labels for each window. These predictions are overlaid against vector or raster maps (e.g., OpenStreetMap) to identify untagged areas, verify existing tags, or detect outdated and mistagged land regions.
  10. Knowl 10 — Class Confusion Patterns in EuroSAT Classification

    empirical result

    Analysis of the class-level confusion matrix for the fine-tuned ResNet-50 classifier on the EuroSAT RGB dataset reveals distinct error patterns:

    • Agricultural Ambiguity: The primary misclassifications occur among the agricultural classes—Annual Crop, Permanent Crop, and Pasture—due to shared spectral and textural features.
    • Linear Structure Confusion: Misclassifications also occur between the Highway and River classes due to structural and morphological similarities in elongated, winding shapes.
    • Built-Up and Natural Separation: Classes with high contrast such as Forest and Sea & Lake exhibit distinct decision boundaries with near-zero confusion against built-up or agricultural classes.

Coverage note — None was omitted; all key contributions including dataset design, spectral band properties, benchmarking protocols, quantitative tables across all splits and datasets, single-band and band-combination evaluations, application workflows, and error characteristics are fully represented.

References

  1. 1.S. Basu, S. Ganguly, S. Mukhopadhyay, R. DiBiano, M. Karki, and R. Nemani, —DeepSat: A learning framework for satellite imagery,— in Proc. 23rd ACM SIGSPATIAL Int. Conf. Adv. Geographic Inf. Syst., 2015, Art. no. 37.
  2. 2.B. Bischke, P. Bhardwaj, A. Gautam, P. Helber, D. Borth, and A. Dengel, —Detection of flooding events in social multimedia and satellite imagery using deep neural networks,— in Proc. MediaEval, 2017.
  3. 3.B. Bischke, D. Borth, C. Schulze, and A. Dengel, —Contextual enrichment of remote-sensed events with social media streams,— in Proc. ACM Multimedia Conf., 2016, pp. 1077–1081.
  4. 4.B. Bischke, P. Helber, J. Folz, D. Borth, and A. Dengel, —Multi-task learning for segmentation of buildings footprints with deep neural networks,— IEEE Int. Conf. Image Process., 2019, arXiv:1709.05932.
  5. 5.B. Bischke, P. Helber, C. Schulze, V. Srinivasan, and D. Borth, —The multimedia satellite task: Emergency response for flooding events,— in Proc. MediaEval, 2017.
  6. 6.M. Castelluccio, G. Poggi, C. Sansone, and L. Verdoliva, —Land use classification in remote sensing images by convolutional neural networks,— 2015, arXiv: 1508.00092.
  7. 7.G. Cheng, J. Han, and X. Lu, —Remote sensing image scene classification: Benchmark and state-of-the-art,— Proc. IEEE, vol. 105, no. 10, pp. 1865–1883, Oct. 2017.
  8. 8.C. De Boor, A Practical Guide to Splines, vol. 27. New York, NY, USA: Springer-Verlag, 1978.
  9. 9.K. He, X. Zhang, S. Ren, and J. Sun, —Deep residual learning for image recognition,— in Proc. IEEE Conf. Comput. Vis. Pattern Recognit., 2016, pp. 770–778.
  10. 10.K. He, X. Zhang, S. Ren, and J. Sun, —Identity mappings in deep residual networks,— in Proc. Eur. Conf. Comput. Vis., Springer, 2016, pp. 630–645.
  11. 11.M. Kampffmeyer, A.-B. Salberg, and R. Jenssen, —Semantic segmentation of small objects and modeling of uncertainty in urban remote sensing images using deep convolutional neural networks,— in Proc. IEEE Conf. Comput. Vis. Pattern Recognit. Workshops, Jun. 2016, pp. 680–688.
  12. 12.A. Krizhevsky, I. Sutskever, and G. E. Hinton, —ImageNet classification with deep convolutional neural networks,— in Proc. Adv. Neural Inf. Process. Syst., 2012, pp. 1097–1105.
  13. 13.Y. LeCun et al., —Backpropagation applied to handwritten zip code recognition,— Neural Comput., vol. 1, no. 4, pp. 541–551, 1989.
  14. 14.M. Lin, Q. Chen, and S. Yan, —Network in network,— 2013, arXiv: 1312.4400.
  15. 15.F. P. Luus, B. P. Salmon, F. van den Bergh, and B. Maharaj, —Multiview deep learning for land-use classification,— IEEE Geosci. Remote Sens. Lett., vol. 12, no. 12, pp. 2448–2452, Dec. 2015.
  16. 16.Z. Ma, Z. Wang, C. Liu, and X. Liu, —Satellite imagery classification based on deep convolution network,— World Acad. Sci. Eng. Technol. Int. J. Comput. Elect., Autom., Control Inf. Eng., vol. 10, no. 6, pp. 1113–1117, 2016.
  17. 17.D. Marmanis, M. Datcu, T. Esch, and U. Stilla, —Deep learning earth observation classification using ImageNet pretrained networks,— IEEE Geosci. Remote Sens. Lett., vol. 13, no. 1, pp. 105–109, Jan. 2016.
  18. 18.K. Ni et al., Large-scale deep learning on the YFCC100M dataset, 2015, arXiv: 1502.03409.
  19. 19.K. Nogueira, O. A. Penatti, and J. A. dos Santos, —Towards better exploiting convolutional neural networks for remote sensing scene classification,— Pattern Recognit., vol. 61, pp. 539–556, 2017.
  20. 20.O. A. Penatti, K. Nogueira, and J. A. dos Santos, —Do deep features generalize from everyday objects to remote sensing and aerial scenes domains?— in Proc. IEEE Conf. Comput. Vis. Pattern Recognit. Workshops, 2015, pp. 44–51.
  21. 21.O. Russakovsky et al., —ImageNet large scale visual recognition challenge,— Int. J. Comput. Vis., vol. 115, no. 3, pp. 211–252, 2015.
  22. 22.G. Sheng, W. Yang, T. Xu, and H. Sun, —High-resolution satellite scene classification using a sparse coding based multiple feature combination,— Int. J. Remote Sens., vol. 33, no. 8, pp. 2395–2412, 2012.
  23. 23.K. Simonyan and A. Zisserman, —Very deep convolutional networks for large-scale image recognition,— 2014, arXiv: 1409.1556.
  24. 24.C. Szegedy, S. Ioffe, V. Vanhoucke, and A. Alemi, —Inception-v4, Inception-ResNet and the impact of residual connections on learning,— in Proc. Thirty-First AAAI Conf. Artif. Intell., 2017.
  25. 25.C. Szegedy et al., —Going deeper with convolutions,— in Proc. IEEE Conf. Comput. Vis. Pattern Recognit., 2015, pp. 1–9.
  26. 26.C. Szegedy, V. Vanhoucke, S. Ioffe, J. Shlens, and Z. Wojna, —Rethinking the inception architecture for computer vision,— in Proc. IEEE Conf. Comput. Vis. Pattern Recognit., 2016, pp. 2818–2826.
  27. 27.G.-S. Xia et al., —Aid: A benchmark dataset for performance evaluation of aerial scene classification,— IEEE Trans. Geosci. Remote Sens., vol. 55, no. 7, pp. 3965–3981, 2017.
  28. 28.G.-S. Xia, W. Yang, J. Delon, Y. Gousseau, H. Sun, and H. Maître, —Structural high-resolution satellite image indexing,— in Proc. ISPRS TC VII Symp. 100 Years Int. Soc. Photogrammetry Remote Sens., vol. 38, 2010, pp. 298–303.
  29. 29.Y. Yang and S. Newsam, —Bag-of-visual-words and spatial extensions for land-use classification,— in Proc. 18th ACM SIGSPATIAL Int. Conf. Adv. Geographic Inf. Syst., 2010, pp. 270–279.
  30. 30.L. Zhao, P. Tang, and L. Huo, —Feature significance-based multibag-of-visual-words model for remote sensing image scene classification,— J. Appl. Remote Sens., vol. 10, no. 3, 2016, Art. no. 035004.
  31. 31.K. Ahmad, K. Pogorelov, M. Riegler, N. Conci, and H. Pal, —CNN and gan based satellite and social media data fusion for disaster detection,— in Proc. MediaEval Workshop, Dublin, Ireland, 2017.
  32. 32.G. Chen et al., —Training small networks for scene classification of remote sensing images via knowledge distillation,— Remote Sens., vol. 10, no. 5, 2018, Art. no. 719.
  33. 33.S. Roy, E. Sangineto, N. Sebe, and B. Demir, —Semantic-fusion gans for semi-supervised satellite image classification,— in Proc. 25th IEEE Int. Conf. Image Process. 2018, Art. no. 684–688.
  34. 34.P. Helber, B. Bischke, A. Dengel, and D. Borth, —Introducing EuroSAT: A novel dataset and deep learning benchmark for land use and land cover classification,— in Proc. IEEE Int. Geosci. Remote Sens. Symp., 2018, pp. 204–207.
  35. 35.L. Huang et al., —Opensarship: A dataset dedicated to sentinel-1 ship interpretation,— IEEE J. Sel. Topics Appl. Earth Observ. Remote Sens., vol. 11, no. 1, pp. 195–208, Jan. 2018.
  36. 36.M. Ponti, A. A. Chaves, F. R. Jorge, G. B. P. Costa, A. Colturato, and K. R. L. J. C. Branco, —Precision agriculture: Using low-cost systems to acquire low-altitude images,— IEEE Comput. Graph. Appl., vol. 36, no. 4, pp. 14–20, Jul./Aug. 2016.
  37. 37.W. Zhou, S. Newsam, C. Li, and Z. Shao, —PatternNet: A benchmark dataset for performance evaluation of remote sensing image retrieval,— ISPRS J. Photogrammetry Remote Sens., 2018.
  38. 38.European Commission. Mapping Guide for a European Urban Atlas. 2012. [Online]. Available: https://ec.europa.eu/regional_policy/sources/tender/pdf/2012066/annexe2.pdf.

Citation

MLA
Helber, P., et al. “EuroSAT: A Novel Dataset and Deep Learning Benchmark for Land Use and Land Cover Classification”. IEEE Journal of Selected Topics in Applied Earth Observations and Remote Sensing, vol. 12, no. 7, 2019, pp. 2217–26, https://doi.org/10.1109/JSTARS.2019.2918242.
APA
Helber, P., Bischke, B., Dengel, A., & Borth, D. (2019). EuroSAT: A Novel Dataset and Deep Learning Benchmark for Land Use and Land Cover Classification. IEEE Journal of Selected Topics in Applied Earth Observations and Remote Sensing, 12(7), 2217–2226. https://doi.org/10.1109/JSTARS.2019.2918242
Chicago
Helber, P., B. Bischke, A. Dengel, and D. Borth. 2019. “EuroSAT: A Novel Dataset and Deep Learning Benchmark for Land Use and Land Cover Classification”. IEEE Journal of Selected Topics in Applied Earth Observations and Remote Sensing 12 (7): 2217–26. https://doi.org/10.1109/JSTARS.2019.2918242.
Harvard
Helber, P. et al. (2019) “EuroSAT: A Novel Dataset and Deep Learning Benchmark for Land Use and Land Cover Classification”, IEEE Journal of Selected Topics in Applied Earth Observations and Remote Sensing, 12(7), pp. 2217–2226. Available at: https://doi.org/10.1109/JSTARS.2019.2918242.
Vancouver
1. Helber P, Bischke B, Dengel A, Borth D (2019) EuroSAT: A Novel Dataset and Deep Learning Benchmark for Land Use and Land Cover Classification. IEEE Journal of Selected Topics in Applied Earth Observations and Remote Sensing 12:2217–2226

BibTeX

@article{Helber_2019, title={EuroSAT: A Novel Dataset and Deep Learning Benchmark for Land Use and Land Cover Classification}, volume={12}, ISSN={2151-1535}, url={http://dx.doi.org/10.1109/JSTARS.2019.2918242}, DOI={10.1109/jstars.2019.2918242}, number={7}, journal={IEEE Journal of Selected Topics in Applied Earth Observations and Remote Sensing}, publisher={Institute of Electrical and Electronics Engineers (IEEE)}, author={Helber, Patrick and Bischke, Benjamin and Dengel, Andreas and Borth, Damian}, year={2019}, month=July, pages={2217–2226} }
Metadata:Crossref

Source Code

This paper has an official code repository available. Click below to access the source code.

View Repository

Access the Paper

This paper is available from its original source. Click below to access the PDF.

Open PDF