Unbiased look at dataset bias

A. TorralbaAlexei A. Efros

article2011CVPR2,844 citations

Exposes pervasive bias in visual recognition benchmarks by proving that classifiers learn unique dataset signatures rather than generalizable visual concepts, and introduces cross-dataset evaluation metrics to measure and mitigate these distortions.

Listen

The article examines how biases in widely used object recognition datasets undermine their value for training and evaluating algorithms intended to work in the real visual world. These datasets, despite being created to represent diverse scenes and objects, each carry distinct signatures that make them easy to distinguish from one another, leading researchers to optimize for benchmark scores rather than broad generalization.

The authors set out to quantify several forms of dataset bias and measure how well current collections support cross-dataset performance. They trained simple classifiers to identify images from twelve popular datasets and ran systematic cross-training and testing experiments on six of them using standard detectors for cars and people.

The experiments revealed that a linear SVM could identify the source dataset with 39 percent accuracy, far above the 8 percent chance level, and that performance on a second dataset typically fell by roughly half compared with testing on the original data. Negative examples drawn from other collections further degraded results for several datasets by 15 to 22 percent, indicating that each collection’s definition ofnot an objectis narrow. Sample-value calculations showed that one training image from a different dataset was worth between 0.2 and 0.9 images from the target dataset, with older collections such as Caltech-101 providing essentially zero transferable value.

These findings indicate that current datasets function more as closed worlds than as reliable proxies for real-world conditions, so gains measured on any single benchmark are unlikely to translate to practical systems. Modern collections such as PASCAL VOC, ImageNet, and SUN09 exhibit less severe bias than their predecessors, yet the overall pattern of limited generalization persists.

The authors recommend that new datasets be subjected to the same cross-collection tests before release and that collection practices favor automatic harvesting from multiple sources, data augmentation, and explicit inclusion of hard negatives mined from large unlabeled pools. They note that the study covers only two object categories and a modest number of datasets, so the magnitude of bias in other domains remains uncertain.

  • Paper: ImageNet: A large-scale hierarchical image database, Jia Deng et al. (2009). It introduces ImageNet, one of the primary foundational datasets whose scale, structure, and domain-shift properties are directly evaluated and critiqued in the source paper.
  • Paper: Adapting Visual Category Models to New Domains, Kate Saenko et al. (2010). It formalizes visual domain adaptation across diverse image sources, establishing key concepts of dataset shift that motivate the source paper's investigation of cross-dataset generalization.
  • Paper: Object Detection with Discriminatively Trained Part-Based Models, Pedro F. Felzenszwalb et al. (2010). It provides the discriminative part-based detection framework and training methodology used to evaluate cross-dataset detector transfer in the source paper.
  • Paper: Describing Objects by their Attributes, Ali Farhadi et al. (2009). It develops cross-dataset attribute learning across Pascal and Yahoo datasets, establishing early experimental foundations for measuring visual transferability across collections.
  • Paper: Learning Multiple Layers of Features from Tiny Images, Alex Krizhevsky (2009). It presents the creation and methodology of the CIFAR-10 and Tiny Images benchmarks, which serve as foundational reference points for early vision dataset construction.
Cover for Unbiased look at dataset bias

Abstract

Datasets are an integral part of contemporary object recognition research. They have been the chief reason for the considerable progress in the field, not just as source of large amounts of training data, but also as means of measuring and comparing performance of competing algorithms. At the same time, datasets have often been blamed for narrowing the focus of object recognition research, reducing it to a single benchmark performance number. Indeed, some datasets, that started out as data capture efforts aimed at representing the visual world, have become closed worlds unto themselves (e.g. the Corel world, the Caltech-101 world, the PASCAL VOC world). With the focus on beating the latest benchmark numbers on the latest dataset, have we perhaps lost sight of the original purpose?

The goal of this paper is to take stock of the current state of recognition datasets. We present a comparison study using a set of popular datasets, evaluated based on a number of criteria including: relative data bias, cross-dataset generalization, effects of closed-world assumption, and sample value. The experimental results, some rather surprising, suggest directions that can improve dataset collection as well as algorithm evaluation protocols. But more broadly, the hope is to stimulate discussion in the community regarding this very important, but largely neglected issue.

Table of Contents

  • 1. Introduction
  • 2. Prologue: The Promise and Perils of Visual Datasets
  • 2.1. The Rise of the Modern Dataset
  • 3. Measuring Dataset Bias
  • 3.1. Cross-dataset generalization
  • 3.2. Negative Set Bias
  • 4. Measuring Dataset's Value
  • 5. Discussion
  • 6. Epilogue
  • References

Knowls

  1. Knowl 1 — Cross-Dataset Generalization and Performance Drop in Object Recognition

    data/table

    To measure the domain specificity and bias of object recognition benchmarks, standard object recognition models are trained on one dataset and tested on another across six popular datasets containing common categories: SUN09, LabelMe, PASCAL VOC 2007, ImageNet, Caltech-101, and MSRC.

    Two tasks are evaluated for the categories "car" and "person":

    1. Classification (predicting image-level presence): Evaluated using a bag-of-words representation paired with a non-linear support vector machine (Gaussian kernel). Training uses 500 positive and 2,000 negative examples per dataset; testing uses 50 positive and 1,000 negative examples.
    2. Detection (predicting object bounding boxes): Evaluated using the Dalal-Triggs Histogram of Oriented Gradients (HOG) detector with a linear SVM. Training uses 100 positive and 1,000 negative examples; testing uses 10 positive and 20,000 negative examples.

    All metrics report Average Precision (AP, in percent) averaged over 20 runs:

    Task Train on Test on Self Mean others
    SUN09 LabelMe PASCAL ImageNet Caltech101 MSRC
    Car SUN09 28.2 29.5 16.3 14.6 16.9 21.9 28.2 19.8
    classification LabelMe 14.7 34.0 16.7 22.9 43.6 24.5 34.0 24.5
    PASCAL 10.1 25.5 35.2 43.9 44.2 39.4 35.2 32.6
    ImageNet 11.4 29.6 36.0 57.4 52.3 42.7 57.4 34.4
    Caltech101 7.5 31.1 19.5 33.1 96.9 42.1 96.9 26.7
    MSRC 9.3 27.0 24.9 32.6 40.3 68.4 68.4 26.8
    Mean others 10.6 28.5 22.7 29.4 39.4 34.1 53.4 27.5
    Car SUN09 69.8 50.7 42.2 42.6 54.7 69.4 69.8 51.9
    detection LabelMe 61.8 67.6 40.8 38.5 53.4 67.0 67.6 52.3
    PASCAL 55.8 55.2 62.1 56.8 54.2 74.8 62.1 59.4
    ImageNet 43.9 31.8 46.9 60.7 59.3 67.8 60.7 49.9
    Caltech101 20.2 18.8 11.0 31.4 100.0 29.3 100.0 22.2
    MSRC 28.6 17.1 32.3 21.5 67.7 74.3 74.3 33.4
    Mean others 42.0 34.7 34.6 38.2 57.9 61.7 72.4 44.8
    Person SUN09 16.1 11.8 14.0 7.9 6.8 23.5 16.1 12.8
    classification LabelMe 11.0 26.6 7.5 6.3 8.4 24.3 26.6 11.5
    PASCAL 11.9 11.1 20.7 13.6 48.3 50.5 20.7 27.1
    ImageNet 8.9 11.1 11.8 20.7 76.7 61.0 20.7 33.9
    Caltech101 7.6 11.8 17.3 22.5 99.6 65.8 99.6 25.0
    MSRC 9.4 15.5 15.3 15.3 93.4 78.4 78.4 29.8
    Mean others 9.8 12.3 13.2 13.1 46.7 45.0 43.7 23.4
    Person SUN09 69.6 56.8 37.9 45.7 52.1 72.7 69.6 53.0
    detection LabelMe 58.9 66.6 38.4 43.1 57.9 68.9 66.6 53.4
    PASCAL 56.0 55.6 56.3 55.6 56.8 74.8 56.3 59.8
    ImageNet 48.8 39.0 40.1 59.6 53.2 70.7 59.6 50.4
    Caltech101 24.6 18.1 12.4 26.6 100.0 31.6 100.0 22.7
    MSRC 33.8 18.2 30.9 20.8 69.5 74.7 74.7 34.6
    Mean others 44.4 37.5 31.9 38.4 57.9 63.7 71.1 45.6

    Performance consistently drops when models are evaluated outside their native training distribution. For instance, car classification exhibits an overall self-test AP of 53.4%, dropping to 27.5% across foreign test sets (a 48% drop). Caltech-101 and MSRC achieve near-perfect within-dataset performance but experience severe cross-dataset drops (73% to 78%), demonstrating high dataset-specific bias. PASCAL VOC and ImageNet demonstrate the highest cross-dataset generalization ability.

  2. Knowl 2 — Dataset Sample Market Value Metric

    equation

    The relative value α\alpha of a training sample from dataset ii when used to train a model evaluated on benchmark dataset jj is defined by the relation:

    APjj(n)=APij(nα)AP_j^j(n) = AP_i^j\left(\frac{n}{\alpha}\right)

    where:

    • nN+n \in \mathbb{N}^+ denotes the number of training samples.
    • APij(n)AP_i^j(n) denotes the Average Precision performance achieved on test dataset jj by a model trained on nn training instances from dataset ii.
    • APjj(n)AP_j^j(n) denotes the native benchmark performance when training on nn instances from dataset jj and testing on dataset jj.
    • α(0,1]\alpha \in (0, 1] represents the effective sample exchange rate or "market value". An exchange rate of α\alpha indicates that 1/α1/\alpha samples from dataset ii are required to achieve the performance provided by a single native sample from dataset jj.

    In log-log coordinates, recognition error log(1AP)\log(1 - AP) scales linearly with training set size log(n)\log(n), allowing α\alpha to be estimated as the constant horizontal shift between log-sample learning curves.

  3. Knowl 3 — Cross-Dataset Sample Market Values for Object Detection

    data/table

    Empirical sample exchange rates ("market values""\text{market values}" α\alpha) measure the relative worth of training instances of "car" from one dataset when training a detector evaluated on another dataset's benchmark test set.

    Training Data Source Target Benchmark Market
    SUN09 LabelMe PASCAL VOC ImageNet Caltech-101
    1 SUN09 sample is worth 1.00 SUN09 0.91 LabelMe 0.72 PASCAL 0.41 ImageNet 0.00 Caltech
    1 LabelMe sample is worth 0.41 SUN09 1.00 LabelMe 0.26 PASCAL 0.31 ImageNet 0.00 Caltech
    1 PASCAL VOC sample is worth 0.29 SUN09 0.50 LabelMe 1.00 PASCAL 0.88 ImageNet 0.00 Caltech
    1 ImageNet sample is worth 0.17 SUN09 0.24 LabelMe 0.40 PASCAL 1.00 ImageNet 0.00 Caltech
    1 Caltech-101 sample is worth 0.18 SUN09 0.23 LabelMe 0.00 PASCAL 0.28 ImageNet 1.00 Caltech
    Basket of Currencies (Average) 0.41 SUN09 0.58 LabelMe 0.48 PASCAL 0.58 ImageNet 0.20 Caltech

    Cross-dataset sample values α\alpha are strictly less than 1.0 across all non-native pairings, reflecting universal devaluation due to dataset bias. For example, in the PASCAL VOC benchmark market, 1 LabelMe sample is worth only 0.260.26 PASCAL samples; achieving the equivalent benefit of 1,250 PASCAL examples with LabelMe data requires 10.26×1250×10=50,000\frac{1}{0.26} \times 1250 \times 10 = 50,000 training samples. Caltech-101 samples have a market value of 0.000.00 in both PASCAL and ImageNet markets.

  4. Knowl 4 — Dataset Discriminability Classifier ("Name That Dataset")

    empirical result

    To quantify whether visual recognition datasets contain unique, dataset-specific visual signatures, a 12-way linear Support Vector Machine (SVM) classifier is trained to identify which dataset an image originates from.

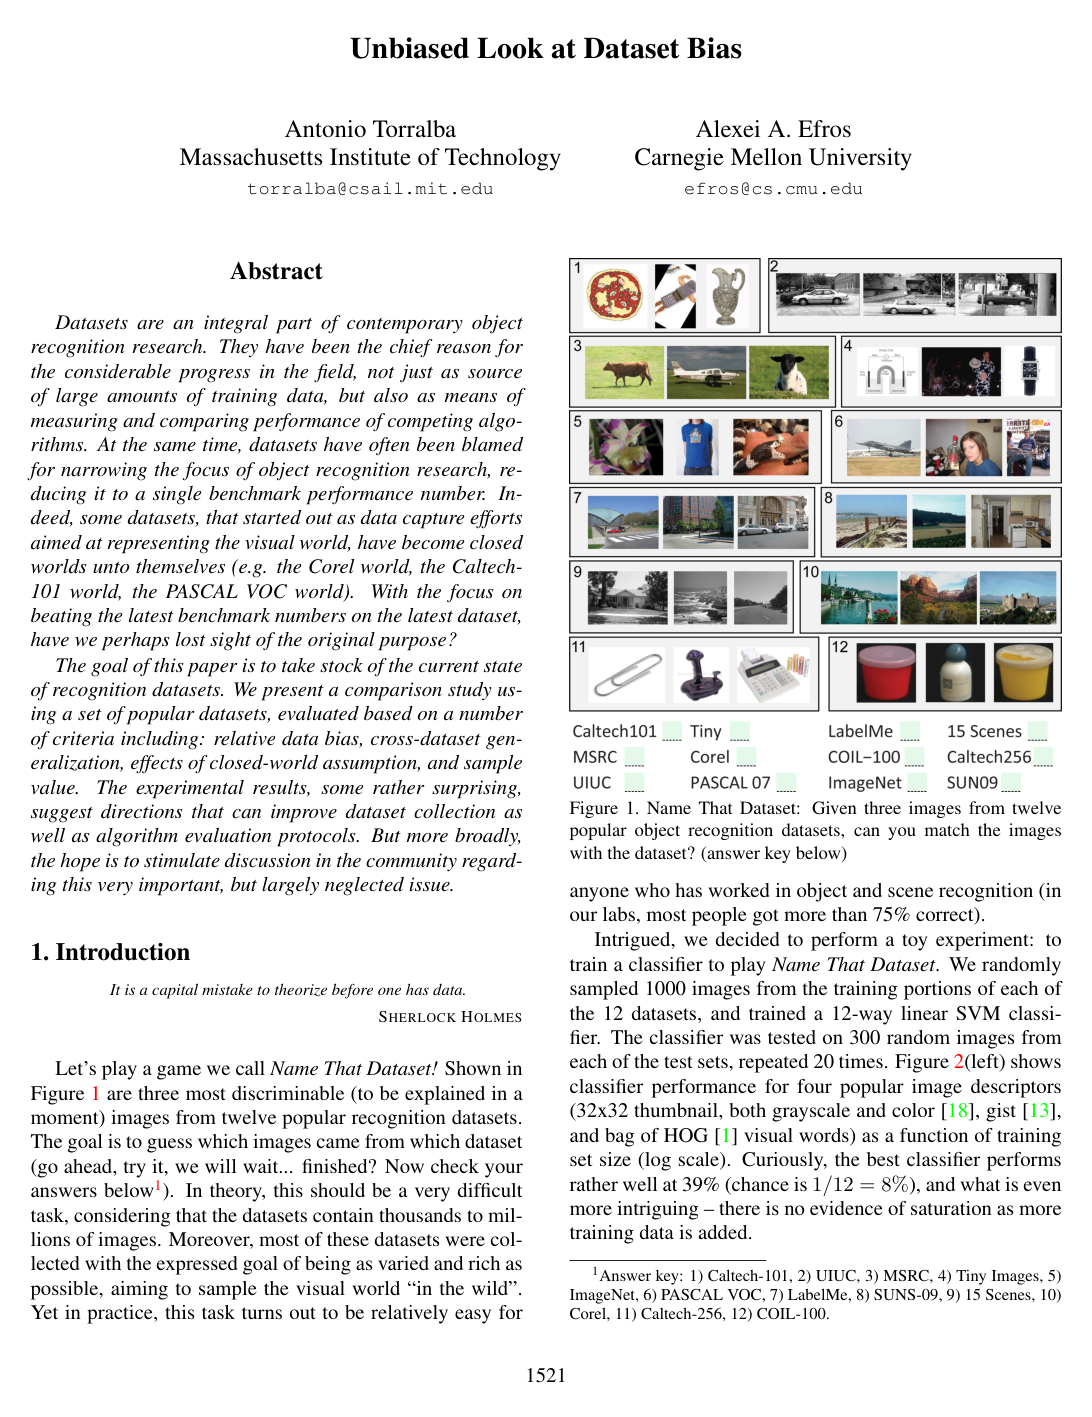
    • Full Image Dataset Discriminability: Using 1,000 training images and 300 test images sampled from 12 datasets (Caltech-101, UIUC, MSRC, Tiny Images, ImageNet, PASCAL VOC 2007, LabelMe, SUN09, 15 Scenes, Corel, Caltech-256, and COIL-100), the classifier attains 39% multi-class classification accuracy using Bag-of-HOG visual words (where chance performance is 1/128.33%1/12 \approx 8.33\%). Performance exhibits a linear improvement against log(training size)\log(\text{training size}) without evidence of saturation.

    • Isolated Object Crop Discriminability: To control for capture differences across scene backgrounds, the same dataset classifier is trained on isolated bounding box crops of cars across five datasets (PASCAL VOC, ImageNet, SUN09, LabelMe, Caltech-101). The 5-way classifier achieves 61% accuracy (where chance performance is 20%20\%). The most discriminative examples reveal category-level biases: Caltech-101 predominantly contains canonical side views, ImageNet emphasizes race cars, PASCAL contains non-canonical viewpoints, and LabelMe contains cars partially occluded by surrounding objects.

  5. Knowl 5 — Negative Set Bias and Superset Cross-Validation

    data/table

    Negative set bias occurs when the negative training or testing distribution of a dataset is unrepresentative of the visual world, leading models to exploit dataset-specific background correlations rather than learning discriminative object features.

    To measure this bias, object detectors (HOG with linear SVM) are trained on native positive and negative samples (100 positives, 1,000 negatives) and tested under two regimes with identical sample sizes (10 positives, 20,000 negatives):

    1. Native Negative Set: Negatives sampled strictly from the native dataset.
    2. Negative Superset: Negatives sampled uniformly from a combined pool containing negative instances from all six evaluated datasets (SUN09, LabelMe, PASCAL VOC, ImageNet, Caltech-101, MSRC).
    Task Negative Set Positive Test Set Mean
    SUN09 LabelMe PASCAL ImageNet Caltech101 MSRC
    Car Native (ßelf") 67.6 62.4 56.3 60.5 97.7 74.5 70.0
    detection Combined (äll") 53.8 51.3 47.1 65.2 97.7 70.0 64.1
    Relative Drop 20% 18% 16% -8% 0% 6% 8%
    Person Native (ßelf") 67.4 68.6 53.8 60.4 100.0 76.7 71.1
    detection Combined (äll") 52.2 58.0 42.6 63.4 100.0 71.5 64.6
    Relative Drop 22% 15% 21% -5% 0% 7% 9%

    For scene-oriented datasets (SUN09, LabelMe, and PASCAL VOC), evaluating against a diverse negative superset induces a 15% to 22% drop in Average Precision, indicating that native negative sets fail to provide sufficient negative variation. ImageNet exhibits no drop due to high inherent negative diversity, while Caltech-101 and MSRC show 0% drop due to saturated ceiling performance on overly simple test sets.

  6. Knowl 6 — Taxonomy of Visual Dataset Biases

    definition

    Visual dataset bias comprises four distinct sources that cause recognition models to overfit to dataset idiosyncrasies rather than generalizing to the broader visual world:

    1. Selection Bias: Bias arising from the data collection mechanism, such as relying on specific search queries, particular geographic regions, or selective photographer genres (e.g., professional stock photos vs. amateur snapshots).
    2. Capture Bias: Bias introduced by how photographers photograph objects, including canonical viewpoints, object-centering preferences, consistent camera heights, and orientation tendencies (e.g., mugs photographed with handles facing right).
    3. Category / Label Bias: Inconsistencies and ambiguities in category definitions across human annotators, leading to differing label boundaries for visually identical concepts (e.g., annotating a scene element as "grass" vs. "lawn", or "painting" vs. "picture").
    4. Negative Set Bias: Bias caused by the composition of the negative instance set defining "the rest of the world". When non-target instances under-represent the visual variety of non-target objects and scenes, classifiers fail to learn essential boundaries (e.g., associating boat detection with water textures rather than boat geometry because water without boats is omitted from the negative set).
  7. Knowl 7 — Guidelines for Diagnosing and Mitigating Visual Dataset Bias

    model/method

    Techniques for identifying and reducing dataset bias during collection and benchmarking:

    • Bias Diagnosis:

      • Run cross-dataset generalization benchmarks on common categories to measure performance drops against native testing.
      • Train multi-class dataset-identification classifiers on dataset splits and object bounding box crops; high classification accuracy indicates strong non-generalizable dataset signatures.
      • Evaluate detectors against pooled negative supersets from multiple external datasets to verify negative set sufficiency.
    • Mitigating Selection Bias:

      • Collect images across multiple distinct search engines and international sources.
      • Sample large pools of unannotated real-world images and rely on crowdsourced annotation rather than search-keyword filtering.
    • Mitigating Capture Bias:

      • Apply data augmentation strategies during training, such as horizontal flipping (with care for directional text) and random spatial jittering/affine transformations.
      • Extract multiple automated randomized crops across different scales and spatial positions.
    • Mitigating Negative Set Bias:

      • Augment training sets with negative images pooled from external, diverse datasets.
      • Perform hard negative mining over very large unlabeled image collections using baseline classifiers, followed by manual filtering to eliminate false negatives.

Coverage note — Omitted the historical review of early computer vision datasets (Lena, COIL-100, Corel, etc.) and general editorial commentary on CVPR benchmark competition culture, as these are background and framing.

References

  1. 1.N. Dalal and B. Triggs. Histogram of oriented gradients for human detection. 2005. 1521, 1524
  2. 2.D. DeCoste and M. Burl. Distortion-invariant recognition via jittered queries. In CVPR, 2000. 1528
  3. 3.J. Deng, W. Dong, R. Socher, L.-J. Li, K. Li, and L. Fei-Fei. ImageNet: A Large-Scale Hierarchical Image Database. 2009. 1523, 1524, 1528
  4. 4.P. Dollár, C. Wojek, B. Schiele, and P. Perona. Pedestrian detection: A benchmark. In CVPR, 2009. 1523, 1524
  5. 5.L. Duan, I. W.-H. Tsang, D. Xu, and S. J. Maybank. Domain transfer svm for video concept detection. In CVPR, 2009. 1524
  6. 6.M. Everingham, L. Van Gool, C. K. I. Williams, J. Winn, and A. Zisserman. The pascal visual object classes (voc) challenge. International Journal of Computer Vision, 88(2):303–338, June 2010. 1523, 1524
  7. 7.L. Fei-Fei, R. Fergus, and P. Perona. Learning generative visual models from few training examples: An incremental bayesian approach tested on 101 object categories. In CVPR Workshop of Generative Model Based Vision, 2004. 1523, 1524
  8. 8.P. Felzenszwalb, D. McAllester, and D. Ramanan. A discriminatively trained, multiscale, deformable part model. In CVPR, 2008. 1524, 1528
  9. 9.G. Griffin, A. Holub, and P. Perona. Caltech-256 object category dataset. Technical report, California Institute of Technology, 2007. 1528
  10. 10.J. Hutchison. Culture, communication, and an information age madonna. In IEEE Professional Communication Society Newsletter, volume 45, 2001. 1523
  11. 11.T. Malisiewicz and A. A. Efros. Recognition by association via learning per-exemplar distances. In CVPR, 2008. 1525
  12. 12.S. A. Nene, S. K. Nayar, and H. Murase. Columbia object image library (coil-100). Technical Report CUCS-006-96, Columbia Univ., 1996. 1523
  13. 13.A. Oliva and A. Torralba. Modeling the shape of the scene: a holistic representation of the spatial envelope. International Journal in Computer Vision, 42:145–175, 2001. 1521, 1523
  14. 14.J. Ponce, T. L. Berg, M. Everingham, D. Forsyth, M. Hebert, S. Lazebnik, M. Marszałek, C. Schmid, C. Russell, A. Torralba, C. Williams, J. Zhang, and A. Zisserman. Dataset issues in object recognition. In Towards Category-Level Object Recognition. Springer, 2006. 1522, 1523, 1527
  15. 15.H. Rowley, S. Baluja, and T. Kanade. Neural network-based face detection. IEEE Transactions on Pattern Analysis and Machine Intelligence, 20(1):23–38, January 1998. 1522
  16. 16.B. C. Russell, A. Torralba, K. P. Murphy, and W. T. Freeman. LabelMe: a database and web-based tool for image annotation. 77(1-3):157–173, 2008. 1523, 1524
  17. 17.K. Saenko, B. Kulis, M. Fritz, and T. Darrell. Transferring visual category models to new domains. In ECCV, 2010. 1524
  18. 18.A. Torralba, R. Fergus, and W. T. Freeman. 80 million tiny images: a large database for non-parametric object and scene recognition. IEEE PAMI, 30(11):1958–1970, November 2008. 1521, 1523, 1528
  19. 19.J. Winn, A. Criminisi, and T. Minka. Object categorization by learned universal visual dictionary. In ICCV, 2005. 1523, 1524
  20. 20.J. Xiao, J. Hays, K. Ehinger, A. Oliva, and A. Torralba. Sun database: Large-scale scene recognition from abbey to zoo. In CVPR, 2010. 1523, 1524
  21. 21.J. Yang, R. Yan, and A. G. Hauptmann. Cross-domain video concept detection using adaptive svms. MULTIMEDIA ’07, 2007. 1524

Citation

MLA
Torralba, A., and A. A. Efros. “Unbiased Look at Dataset Bias”. CVPR 2011, 2011, pp. 1521–28, https://doi.org/10.1109/CVPR.2011.5995347.
APA
Torralba, A., & Efros, A. A. (2011). Unbiased look at dataset bias. CVPR 2011, 1521–1528. https://doi.org/10.1109/CVPR.2011.5995347
Chicago
Torralba, A., and A. A. Efros. 2011. “Unbiased Look at Dataset Bias”. CVPR 2011, 1521–28. https://doi.org/10.1109/CVPR.2011.5995347.
Harvard
Torralba, A. and Efros, A.A. (2011) “Unbiased look at dataset bias”, CVPR 2011. IEEE, pp. 1521–1528. Available at: https://doi.org/10.1109/CVPR.2011.5995347.
Vancouver
1. Torralba A, Efros AA (2011) Unbiased look at dataset bias. In: CVPR 2011. IEEE, pp 1521–1528

BibTeX

@inproceedings{Torralba_2011, title={Unbiased look at dataset bias}, url={http://dx.doi.org/10.1109/CVPR.2011.5995347}, DOI={10.1109/cvpr.2011.5995347}, booktitle={CVPR 2011}, publisher={IEEE}, author={Torralba, Antonio and Efros, Alexei A.}, year={2011}, month=June, pages={1521–1528} }
Metadata:Crossref

Access the Paper

This paper is available from its original source. Click below to access the PDF.

Open PDF

License: IEEE