Structure-Measure: A New Way to Evaluate Foreground Maps

Deng-Ping FanMing-Ming ChengYun LiuTao LiAli Borji

article2017IJCV1,931 citations

Proposes the Structure-measure, an evaluation metric that combines region-aware and object-aware structural similarity to assess salient object detection algorithms more accurately than conventional pixel-wise measures.

Listen

Accurately evaluating foreground and salient object detection models is vital across modern computer vision tasks, including semantic segmentation, image retrieval, and object detection. However, standard evaluation metrics rely on pixel-level error comparisons and fail to capture global object structure. This structural blind spot causes conventional metrics to misrank predicted maps, often scoring degraded or incomplete object shapes higher than well-preserved detections.

The article aims to design and validate a novel evaluation metric, termed Structure-measure, that assesses structural similarity between non-binary predicted maps and ground-truth human annotations. The proposed approach balances both region-aware structural information, which recursively evaluates sub-regions, and object-aware similarity, which evaluates global foreground-background contrast and uniform saliency distribution.

To establish credibility, the authors validated the metric across five benchmark image datasets using ten state-of-the-art salient object detection models and five diagnostic meta-measures. In these tests, Structure-measure consistently outperformed existing metrics, demonstrating superior ranking consistency with practical applications and reducing incorrect ground-truth match errors by 18% to 69% compared to the previous leading metric. Furthermore, in a controlled behavioral study of 45 human participants across 50 paired evaluations, viewers agreed with Structure-measure rankings 64% to 74% of the time over traditional alternatives, all while maintaining high computational efficiency at roughly 5.3 milliseconds per image.

These findings indicate that relying on legacy pixel-based metrics creates significant risk of selecting suboptimal computer vision models in real-world deployments. Adopting Structure-measure provides engineering and development teams with a more reliable benchmark to guide model selection and improve downstream system performance without incurring high computational overhead.

The source recommends that practitioners and researchers adopt Structure-measure to evaluate and compare salient object detection models. Future efforts should focus on integrating this metric into training loss pipelines and expanding evaluations to broader segmentation tasks. Because the current formulation assumes binary ground-truth reference maps and relies on specific parameter weightings, teams should ensure these operational assumptions align with their specific production environments.

Cover for Structure-Measure: A New Way to Evaluate Foreground Maps

Abstract

Foreground map evaluation is crucial for gauging the progress of object segmentation algorithms, in particular in the filed of salient object detection where the purpose is to accurately detect and segment the most salient object in a scene. Several widely-used measures such as Area Under the Curve (AUC), Average Precision (AP) and the recently proposed Fbw have been utilized to evaluate the similarity between a non-binary saliency map (SM) and a ground-truth (GT) map. These measures are based on pixel-wise errors and often ignore the structural similarities. Behavioral vision studies, however, have shown that the human visual system is highly sensitive to structures in scenes. Here, we propose a novel, efficient, and easy to calculate measure known an structural similarity measure (Structure-measure) to evaluate non-binary foreground maps. Our new measure simultaneously evaluates region-aware and object-aware structural similarity between a SM and a GT map. We demonstrate superiority of our measure over existing ones using 5 meta-measures on 5 benchmark datasets.

Table of Contents

  • 1 Introduction
  • 2 Current Evaluation Measures
  • 3 Limitations of Current Measures
  • 4 Our measure
  • 4.1 Region-aware structural similarity measure
  • 4.2 Object-aware structural similarity measure
  • 4.3 Our new structure-measure
  • 5 Experiments
  • 5.1 Meta-Measure 1: Application Ranking
  • 5.2 Meta-Measure 2: State-of-the-art vs. Generic
  • 5.3 Meta-Measure 3: Ground-truth Switch
  • 5.4 Meta-Measure 4: Annotation errors
  • 5.5 Further comparison
  • 5.6 Meta-Measure 5: Human judgments
  • 5.7 Saliency model comparison
  • 6 Discussion and Conclusion
  • References

Knowls

  1. Knowl 1 — Structure-measure (S-measure) for Evaluating Non-Binary Foreground Maps

    model/method

    The Structure-measure (SS-measure) evaluates the similarity between a non-binary predicted foreground (saliency) map SM∈[0,1]W×HSM \in [0, 1]^{W \times H} and a binary ground-truth map GT∈{0,1}W×HGT \in \{0, 1\}^{W \times H}. It combines an object-aware structural similarity measure (SoS_o) and a region-aware structural similarity measure (SrS_r) through a convex linear combination:

    S=α⋅So+(1−α)⋅SrS = \alpha \cdot S_o + (1 - \alpha) \cdot S_r

    where α∈[0,1]\alpha \in [0, 1] balances the contribution of object-level and region-level similarities (set to α=0.5\alpha = 0.5 by default). S∈[0,1]S \in [0, 1], with higher values indicating greater structural agreement. The measure simultaneously assesses whether the object as a whole contrasts sharply with the background with uniform saliency, and whether individual constituent object parts preserve spatial structural coherence.

  2. Knowl 2 — Object-Aware Structural Similarity Measure

    model/method

    The object-aware structural similarity measure SoS_o evaluates global foreground and background consistency based on two properties: sharp foreground-background contrast and uniform saliency distribution across detected objects.

    Let xFGx_{FG} and yFGy_{FG} denote the predicted saliency and ground-truth values in the foreground region ({i∣GT(i)=1}\{i \mid GT(i) = 1\}), with sample means xˉFG\bar{x}_{FG} and yˉFG\bar{y}_{FG}, and sample standard deviation σxFG\sigma_{x_{FG}}. Because the binary ground truth has yˉFG=1\bar{y}_{FG} = 1, the foreground dissimilarity incorporates the coefficient of variation (σxFG/xˉFG\sigma_{x_{FG}} / \bar{x}_{FG}) to penalize non-uniform predictions:

    DFG=(xˉFG)2+(yˉFG)22xˉFGyˉFG+λ⋅σxFGxˉFG=(xˉFG)2+12xˉFG+λ⋅σxFGxˉFGD_{FG} = \frac{(\bar{x}_{FG})^2 + (\bar{y}_{FG})^2}{2\bar{x}_{FG}\bar{y}_{FG}} + \lambda \cdot \frac{\sigma_{x_{FG}}}{\bar{x}_{FG}} = \frac{(\bar{x}_{FG})^2 + 1}{2\bar{x}_{FG}} + \lambda \cdot \frac{\sigma_{x_{FG}}}{\bar{x}_{FG}}

    The foreground similarity OFGO_{FG} is defined as the reciprocal of dissimilarity:

    OFG=1DFG=2xˉFG(xˉFG)2+1+2λ⋅σxFGO_{FG} = \frac{1}{D_{FG}} = \frac{2\bar{x}_{FG}}{(\bar{x}_{FG})^2 + 1 + 2\lambda \cdot \sigma_{x_{FG}}}

    The background similarity OBGO_{BG} is computed analogously on the inverted maps (1−SM1 - SM and 1−GT1 - GT):

    OBG=2xˉBG(xˉBG)2+1+2λ⋅σxBGO_{BG} = \frac{2\bar{x}_{BG}}{(\bar{x}_{BG})^2 + 1 + 2\lambda \cdot \sigma_{x_{BG}}}

    where xˉBG\bar{x}_{BG} and σxBG\sigma_{x_{BG}} are the mean and standard deviation of 1−SM1 - SM across the background region ({i∣GT(i)=0}\{i \mid GT(i) = 0\}). The overall object-aware similarity is weighted by the relative foreground area:

    So=μ⋅OFG+(1−μ)⋅OBGS_o = \mu \cdot O_{FG} + (1 - \mu) \cdot O_{BG}

    where μ=∑iGT(i)W×H\mu = \frac{\sum_{i} GT(i)}{W \times H} is the ratio of ground-truth foreground area to total image area, and λ\lambda is a positive weighting constant set to λ=0.5\lambda = 0.5.

  3. Knowl 3 — Region-Aware Structural Similarity Measure

    model/method

    The region-aware structural similarity measure SrS_r evaluates object-part structure similarity by recursively partitioning the image into spatial blocks aligned with the foreground object.

    1. Centroid-Based Partitioning: The image domain is divided into four blocks along horizontal and vertical cut-off lines intersecting at the centroid (cx,cy)(c_x, c_y) of the ground-truth foreground mask. This division can be repeated recursively to yield KK sub-regions (with K=4K = 4 corresponding to a single partition level).

    2. Block-Level SSIM: For each block k∈{1,…,K}k \in \{1, \dots, K\}, the standard Structural Similarity Index (SSIM) is computed between the predicted saliency map block xkx_k and the ground-truth block yky_k:

    ssim(k)=(2xˉkyˉkxˉk2+yˉk2)⋅(2σxkσykσxk2+σyk2)⋅(σxkykσxkσyk)\text{ssim}(k) = \left( \frac{2\bar{x}_k\bar{y}_k}{\bar{x}_k^2 + \bar{y}_k^2} \right) \cdot \left( \frac{2\sigma_{x_k}\sigma_{y_k}}{\sigma_{x_k}^2 + \sigma_{y_k}^2} \right) \cdot \left( \frac{\sigma_{x_k y_k}}{\sigma_{x_k}\sigma_{y_k}} \right)

    where xˉk,yˉk\bar{x}_k, \bar{y}_k are pixel means, σxk,σyk\sigma_{x_k}, \sigma_{y_k} are standard deviations, and σxkyk\sigma_{x_k y_k} is the covariance.

    1. Weighted Aggregation: Blocks are weighted according to the proportion of total ground-truth foreground pixels they contain:

    Sr=∑k=1Kwk⋅ssim(k)S_r = \sum_{k=1}^K w_k \cdot \text{ssim}(k)

    where wk=∑i∈block kGT(i)∑jGT(j)w_k = \frac{\sum_{i \in \text{block } k} GT(i)}{\sum_{j} GT(j)} satisfies ∑k=1Kwk=1\sum_{k=1}^K w_k = 1.

  4. Knowl 4 — Human Judgments Meta-Measure for Evaluation Metric Validation

    model/method

    To evaluate how well an automated evaluation metric aligns with human perceptual preferences (Meta-Measure 5):

    1. Generate non-binary saliency maps using a set of diverse algorithms for each image in a benchmark dataset.
    2. For each image, determine the top-ranked saliency map selected by the candidate metric and by an alternative baseline metric (e.g., FβwF_\beta^w). If the two metrics choose maps at different positions within each other's rankings, the rank distance is ∣n−1∣>0|n - 1| > 0.
    3. For pairs of candidate maps where the two metrics disagree on the best map (and visual differences are unambiguous), present the ground-truth mask alongside both predicted maps to human subjects in a two-alternative forced-choice interface.
    4. Calculate the percentage of trials in which human observers choose the saliency map favored by the candidate evaluation metric over the one favored by the competing metric. A higher selection percentage indicates closer alignment with human perceptual judgment of segmentation quality.
  5. Knowl 5 — Benchmark Evaluation of Foreground Map Metrics Across Meta-Measures

    data/table

    Evaluation metrics—Average Precision (AP), Area Under the Curve (AUC), weighted F-measure (FβwF_\beta^w), and Structure-measure (Ours)—were evaluated on four benchmark datasets (PASCAL-S, ECSSD, SOD, HKU-IS) using three meta-measures:

    • MM1 (Application Ranking): 1−Spearman’s ρ1 - \text{Spearman's } \rho ranking inconsistency between saliency map evaluation and post-processing application output (SalCut); lower is better.
    • MM2 (State-of-the-Art vs. Generic): Error rate (%) where a generic center-Gaussian map outranks the average score of state-of-the-art models; lower is better.
    • MM3 (Ground-truth Switch): Error rate (%) where an incorrect ground-truth mask yields a higher score for a good saliency map than the true ground truth; lower is better.
    Metric PASCAL-S ECSSD SOD HKU-IS
    MM1 MM2(%) MM3(%) MM1 MM2(%) MM3(%) MM1 MM2(%) MM3(%) MM1 MM2(%) MM3(%)
    AP 0.452 12.1 5.50 0.449 9.70 3.32 0.504 9.67 7.69 0.518 3.76 1.25
    AUC 0.449 15.8 8.21 0.436 12.1 4.18 0.547 14.0 8.27 0.519 7.02 2.12
    Fbw 0.365 7.06 1.05 0.401 3.00 0.84 0.384 16.3 0.73 0.498 0.36 0.26
    Ours 0.320 4.59 0.34 0.312 3.30 0.47 0.349 9.67 0.60 0.424 0.34 0.08

    Structure-measure consistently achieves the lowest ranking inconsistency in application ranking (MM1) and the lowest error rates under ground-truth switching (MM3) across all four datasets, reducing MM3 errors by 67.62% on PASCAL-S, 44.05% on ECSSD, 17.81% on SOD, and 69.23% on HKU-IS relative to the second-best measure.

  6. Knowl 6 — Human Preference Evaluation of Evaluation Measures

    empirical result

    In a behavioral user study involving 45 participants evaluating 50 pairs of saliency maps where metrics disagreed on the top-ranking map:

    • Participants preferred the saliency map ranked first by Structure-measure over the map ranked first by FβwF_\beta^w in 63.69% of trials on average.
    • In pairwise comparisons against traditional measures, maps preferred by Structure-measure were chosen in 72.11% of trials over AP-preferred maps and 73.56% of trials over AUC-preferred maps.

    These results demonstrate that Structure-measure correlates significantly better with human visual perception of object structure completeness than AP, AUC, and FβwF_\beta^w.

  7. Knowl 7 — Meta-Measure Evaluation on the ASD Dataset

    empirical result

    On the ASD1000 dataset evaluated with 5,000 saliency maps generated from five models (CA, CB, RC, PCA, SVO):

    • Meta-Measure 1 (Application Ranking): Structure-measure achieved a ranking inconsistency (1−Spearman’s ρ1 - \text{Spearman's } \rho) of 0.573, outperforming AP (0.666), AUC (0.596), and FβwF_\beta^w (0.614).
    • Meta-Measure 2 (State-of-the-Art vs. Generic): Structure-measure produced an error rate of 1.10% (11 errors out of 1,000 images), compared to 1.50% for FβwF_\beta^w, 18.90% for AP, and 19.30% for AUC.
    • Meta-Measure 3 (Ground-truth Switch): When tested on 100 random ground-truth switches per image across the top 41.8% good maps, Structure-measure achieved an error rate of 0.03%, more than 10 times lower than FβwF_\beta^w (0.35%), and far lower than AP (3.36%) and AUC (3.84%).
  8. Knowl 8 — Failure Modes of Pixel-Wise Error Measures in Structural Evaluation

    limitation

    Evaluation measures based purely on pixel-level confusion matrices (AP, AUC, FβF_\beta, and FβwF_\beta^w) exhibit systematic failure modes when assessing foreground maps:

    1. Invariance to Structural Destruction: Identical counts of false positives and false negatives yield identical metric scores regardless of spatial configuration. For example, an interior hole versus a complete boundary disruption can produce identical pixel errors but drastically different object recognizability.
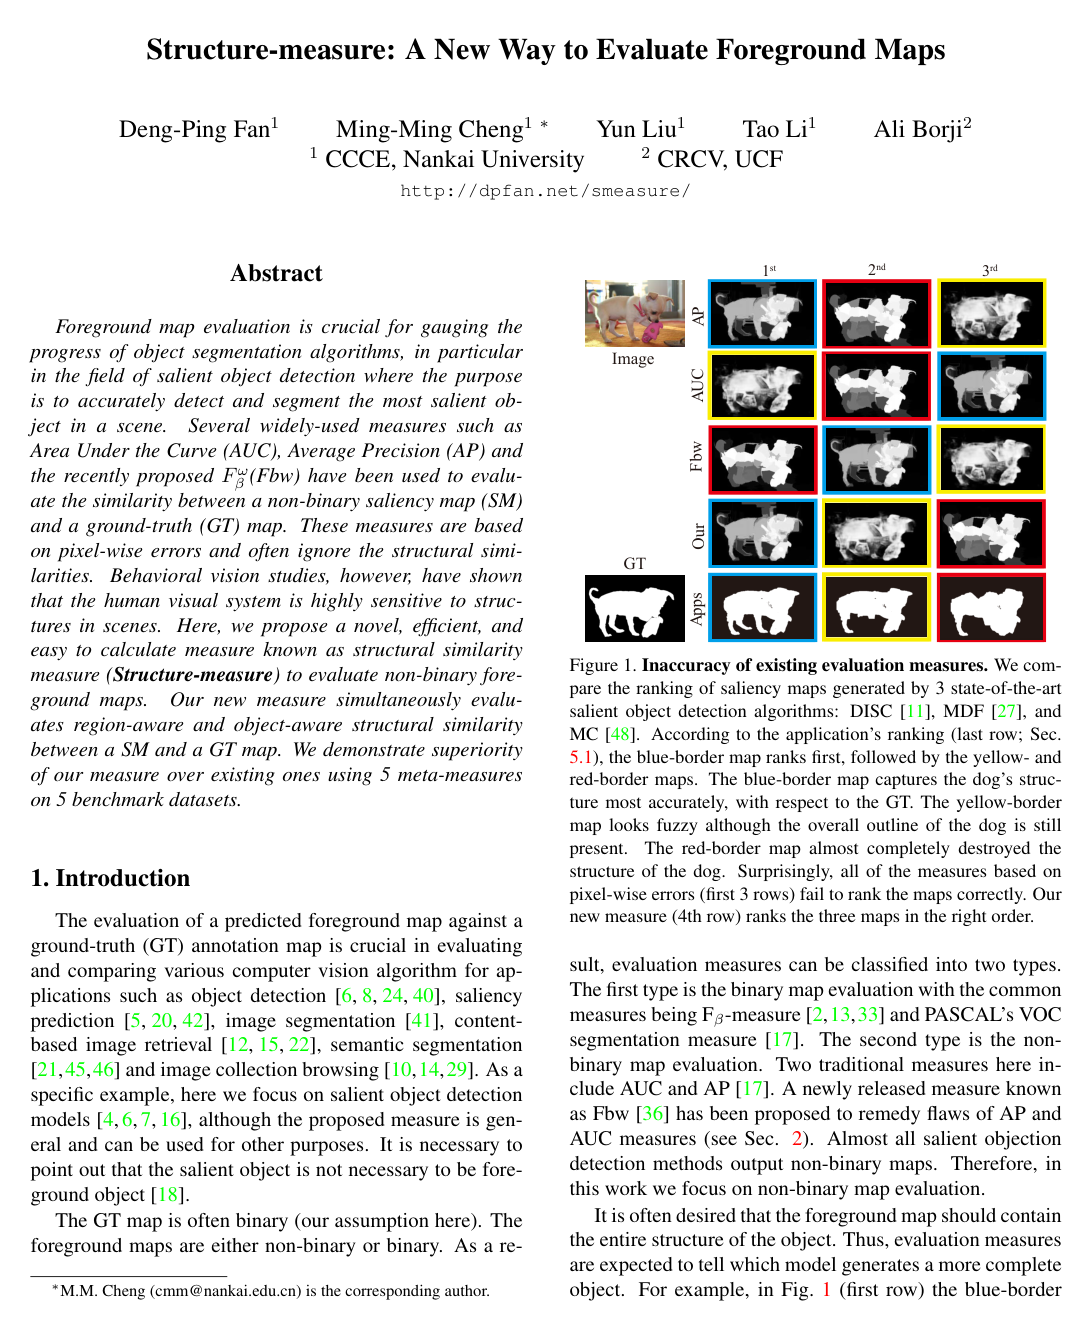
    2. Preference for Incomplete or Fuzzy Detections: Pixel-wise weighting schemes can favor maps that highlight only a sub-part of an object with high confidence over maps that detect the entire global shape with minor intensity variations, leading to incorrect rankings for downstream segmentation tasks.
  9. Knowl 9 — Structural Sensitivity Limitations of the Annotation Error Meta-Measure (MM4)

    limitation

    Meta-Measure 4 (MM4) evaluates metric robustness by measuring ranking stability (1−Spearman’s ρ1 - \text{Spearman's } \rho) when ground-truth boundaries undergo minor morphological transformations. However, MM4 has a fundamental conceptual limitation:

    • While small morphological perturbations that leave object topology unchanged should not alter saliency map rankings, morphological operations frequently induce major structural alterations on thin structures (e.g., eroding thin legs, slender feet, or fine lines; observed in 95% of the top 10% most-altered ground truths).
    • When ground-truth structure changes substantially, an ideal structure-aware metric should change its ranking to reward maps that match the new morphology. MM4 penalizes any rank change indiscriminately, misclassifying valid structural sensitivity as metric instability.

Coverage note — Omitted introductory surveys of standard saliency detection models, basic SSIM background equations that are superseded by the paper's specific $S_r$ and $S_o$ definitions, and generic descriptions of datasets.

References

  1. 1.R. Achanta, S. Hemami, F. Estrada, and S. Susstrunk. Frequency-tuned salient region detection. In IEEE CVPR, pages 1597–1604, 2009.
  2. 2.P. Arbelaez, M. Maire, C. Fowlkes, and J. Malik. Contour detection and hierarchical image segmentation. IEEE TPAMI, 33(5):898–916, 2011.
  3. 3.D. Best and D. Roberts. Algorithm as 89: the upper tail probabilities of spearman’s rho. Journal of the Royal Statistical Society. Series C (Applied Statistics), 24(3):377–379, 1975.
  4. 4.A. Borji. What is a salient object? a dataset and a baseline model for salient object detection. IEEE TIP, 24(2):742–756, 2015.
  5. 5.A. Borji, M.-M. Cheng, H. Jiang, and J. Li. Salient object detection: A survey. arXiv preprint arXiv:1411.5878, 2014.
  6. 6.A. Borji, M.-M. Cheng, H. Jiang, and J. Li. Salient object detection: A benchmark. IEEE TIP, 24(12):5706–5722, 2015.
  7. 7.A. Borji and L. Itti. State-of-the-art in visual attention modeling. IEEE TPAMI, 35(1):185–207, 2013.
  8. 8.Z. Bylinskii, T. Judd, A. Borji, L. Itti, F. Durand, A. Oliva, and A. Torralba. Mit saliency benchmark (2015). 2015.
  9. 9.K.-Y. Chang, T.-L. Liu, H.-T. Chen, and S.-H. Lai. Fusing generic objectness and visual saliency for salient object detection. In IEEE ICCV, pages 914–921, 2011.
  10. 10.T. Chen, M.-M. Cheng, P. Tan, A. Shamir, and S.-M. Hu. Sketch2photo: internet image montage. ACM TOG, 28(5):124, 2009.
  11. 11.T. Chen, L. Lin, L. Liu, X. Luo, and X. Li. Disc: Deep image saliency computing via progressive representation learning. IEEE transactions on neural networks and learning systems, 27(6):1135–1149, 2016.
  12. 12.T. Chen, P. Tan, L.-Q. Ma, M.-M. Cheng, A. Shamir, and S.-M. Hu. Poseshop: Human image database construction and personalized content synthesis. Visualization and Computer Graphics, IEEE Transactions on, 19(5):824–837, 2013.
  13. 13.M. Cheng, N. J. Mitra, X. Huang, P. H. Torr, and S. Hu. Global contrast based salient region detection. IEEE TPAMI, 37(3):569–582, 2015.
  14. 14.M.-M. Cheng, Q.-B. Hou, S.-H. Zhang, and P. L. Rosin. Intelligent visual media processing: When graphics meets vision. Journal of Computer Science and Technology, 32(1):110–121, 2017.
  15. 15.M.-M. Cheng, N. Mitra, X. Huang, and S.-M. Hu. Salientshape: group saliency in image collections. The Visual Computer, 30(4):443–453, 2014.
  16. 16.M.-M. Cheng, J. Warrell, W.-Y. Lin, S. Zheng, V. Vineet, and N. Crook. Efficient salient region detection with soft image abstraction. In IEEE ICCV, pages 1529–1536, 2013.
  17. 17.M. Everingham, L. Van Gool, C. K. Williams, J. Winn, and A. Zisserman. The pascal visual object classes (voc) challenge. IJCV, 88(2):303–338, 2010.
  18. 18.D. Feng, N. Barnes, S. You, and C. McCarthy. Local background enclosure for rgb-d salient object detection. In IEEE CVPR, pages 2343–2350, 2016.
  19. 19.S. Goferman, L. Zelnik-Manor, and A. Tal. Context-aware saliency detection. IEEE TPAMI, 34(10):1915–1926, 2012.
  20. 20.Q. Hou, M.-M. Cheng, X. Hu, Z. Tu, and A. Borji. Deeply supervised salient object detection with short connections. In IEEE CVPR, 2017.
  21. 21.S.-M. Hu, T. Chen, K. Xu, M.-M. Cheng, and R. Martin. Internet visual media processing: a survey with graphics and vision applications. The Visual Computer, 29(5):393–405, 2013.
  22. 22.H. Jiang, M.-M. Cheng, S.-J. Li, A. Borji, and J. Wang. Joint Salient Object Detection and Existence Prediction. Front. Comput. Sci., 2017.
  23. 23.H. Jiang, J. Wang, Z. Yuan, T. Liu, N. Zheng, and S. Li. Automatic salient object segmentation based on context and shape prior. In BMVC, 2011.
  24. 24.C. Kanan and G. Cottrell. Robust classification of objects, faces, and flowers using natural image statistics. In IEEE CVPR, pages 2472–2479, 2010.
  25. 25.S. Lazebnik, C. Schmid, and J. Ponce. Beyond bags of features: Spatial pyramid matching for recognizing natural scene categories. In IEEE CVPR, pages 2169–2178, 2006.
  26. 26.G. Lee, Y.-W. Tai, and J. Kim. Deep saliency with encoded low level distance map and high level features. In IEEE CVPR, pages 660–668, 2016.
  27. 27.G. Li and Y. Yu. Visual saliency based on multiscale deep features. In IEEE CVPR, pages 5455–5463, 2015.
  28. 28.G. Li and Y. Yu. Deep contrast learning for salient object detection. In IEEE CVPR, pages 478–487, 2016.
  29. 29.L. Li, S. Jiang, Z.-J. Zha, Z. Wu, and Q. Huang. Partial-duplicate image retrieval via saliency-guided visual matching. MultiMedia, IEEE, 20(3):13–23, 2013.
  30. 30.X. Li, H. Lu, L. Zhang, X. Ruan, and M.-H. Yang. Saliency detection via dense and sparse reconstruction. In IEEE ICCV, pages 2976–2983, 2013.
  31. 31.Y. Li, X. Hou, C. Koch, J. M. Rehg, and A. L. Yuille. The secrets of salient object segmentation. In IEEE CVPR, pages 280–287, 2014.
  32. 32.N. Liu and J. Han. Dhsnet: Deep hierarchical saliency network for salient object detection. In IEEE CVPR, pages 678–686, 2016.
  33. 33.T. Liu, Z. Yuan, J. Sun, J. Wang, N. Zheng, X. Tang, and H.-Y. Shum. Learning to detect a salient object. IEEE TPAMI, 33(2):353–367, 2011.
  34. 34.Z. Liu, W. Zou, and O. Le Meur. Saliency tree: A novel saliency detection framework. IEEE TIP, 23(5):1937–1952, 2014.
  35. 35.R. Margolin, A. Tal, and L. Zelnik-Manor. What makes a patch distinct? In IEEE CVPR, pages 1139–1146, 2013.
  36. 36.R. Margolin, L. Zelnik-Manor, and A. Tal. How to evaluate foreground maps? In IEEE CVPR, pages 248–255, 2014.
  37. 37.D. Martin, C. Fowlkes, D. Tal, and J. Malik. A database of human segmented natural images and its application to evaluating segmentation algorithms and measuring ecological statistics. In IEEE ICCV, 2001.
  38. 38.N. R. Pal and S. K. Pal. A review on image segmentation techniques. Pattern recognition, 26(9):1277–1294, 1993.
  39. 39.J. Pont-Tuset and F. Marques. Measures and meta-measures for the supervised evaluation of image segmentation. In IEEE CVPR, pages 2131–2138, 2013.
  40. 40.W. Qi, M.-M. Cheng, A. Borji, H. Lu, and L.-F. Bai. Saliencyrank: Two-stage manifold ranking for salient object detection. Computational Visual Media, 1(4):309–320, 2015.
  41. 41.C. Qin, G. Zhang, Y. Zhou, W. Tao, and Z. Cao. Integration of the saliency-based seed extraction and random walks for image segmentation. Neurocomputing, 129:378–391, 2014.
  42. 42.J. Wang, H. Jiang, Z. Yuan, M.-M. Cheng, X. Hu, and N. Zheng. Salient object detection: A discriminative regional feature integration approach. IJCV, 123(2):251–268, 2017.
  43. 43.L. Wang, L. Wang, H. Lu, P. Zhang, and X. Ruan. Saliency detection with recurrent fully convolutional networks. In ECCV, pages 825–841, 2016.
  44. 44.Z. Wang, A. C. Bovik, H. R. Sheikh, and E. P. Simoncelli. Image quality assessment: from error visibility to structural similarity. IEEE TIP, 13(4):600–612, 2004.
  45. 45.Y. Wei, J. Feng, X. Liang, M.-M. Cheng, Y. Zhao, and S. Yan. Object region mining with adversarial erasing: A simple classification to semantic segmentation approach. In IEEE CVPR, 2017.
  46. 46.Y. Wei, X. Liang, Y. Chen, X. Shen, M.-M. Cheng, Y. Zhao, and S. Yan. Stc: A simple to complex framework for weakly-supervised semantic segmentation. IEEE TPAMI, 2016.
  47. 47.Y. Xie, H. Lu, and M.-H. Yang. Bayesian saliency via low and mid level cues. IEEE TIP, 22(5):1689–1698, 2013.
  48. 48.R. Zhao, W. Ouyang, H. Li, and X. Wang. Saliency detection by multi-context deep learning. In IEEE CVPR, pages 1265–1274, 2015.

Citation

MLA
Fan, D.-P., et al. “Structure-measure: A New Way to Evaluate Foreground Maps”. arXiv, 2017, http://arxiv.org/abs/1708.00786v1.
APA
Fan, D.-P., Cheng, M.-M., Liu, Y., Li, T., & Borji, A. (2017). Structure-measure: A New Way to Evaluate Foreground Maps. arXiv. http://arxiv.org/abs/1708.00786v1
Chicago
Fan, D.-P., M.-M. Cheng, Y. Liu, T. Li, and A. Borji. 2017. “Structure-measure: A New Way to Evaluate Foreground Maps”. arXiv. http://arxiv.org/abs/1708.00786v1.
Harvard
Fan, D.-P. et al. (2017) “Structure-measure: A New Way to Evaluate Foreground Maps”, arXiv [Preprint]. Available at: http://arxiv.org/abs/1708.00786v1.
Vancouver
1. Fan D-P, Cheng M-M, Liu Y, Li T, Borji A (2017) Structure-measure: A New Way to Evaluate Foreground Maps. arXiv

BibTeX

@article{fan2017structure,
  title = {Structure-measure: A New Way to Evaluate Foreground Maps},
  author = {Fan, Deng-Ping and Cheng, Ming-Ming and Liu, Yun and Li, Tao and Borji, Ali},
  year = {2017},
  journal = {arXiv},
  url = {http://arxiv.org/abs/1708.00786v1},
  eprint = {1708.00786}
}
Metadata:arXiv

Source Code

This paper has an official code repository available. Click below to access the source code.

View Repository

Access the Paper

This paper is available from its original source. Click below to access the PDF.

Open PDF

License: https://creativecommons.org/licenses/by/4.0/