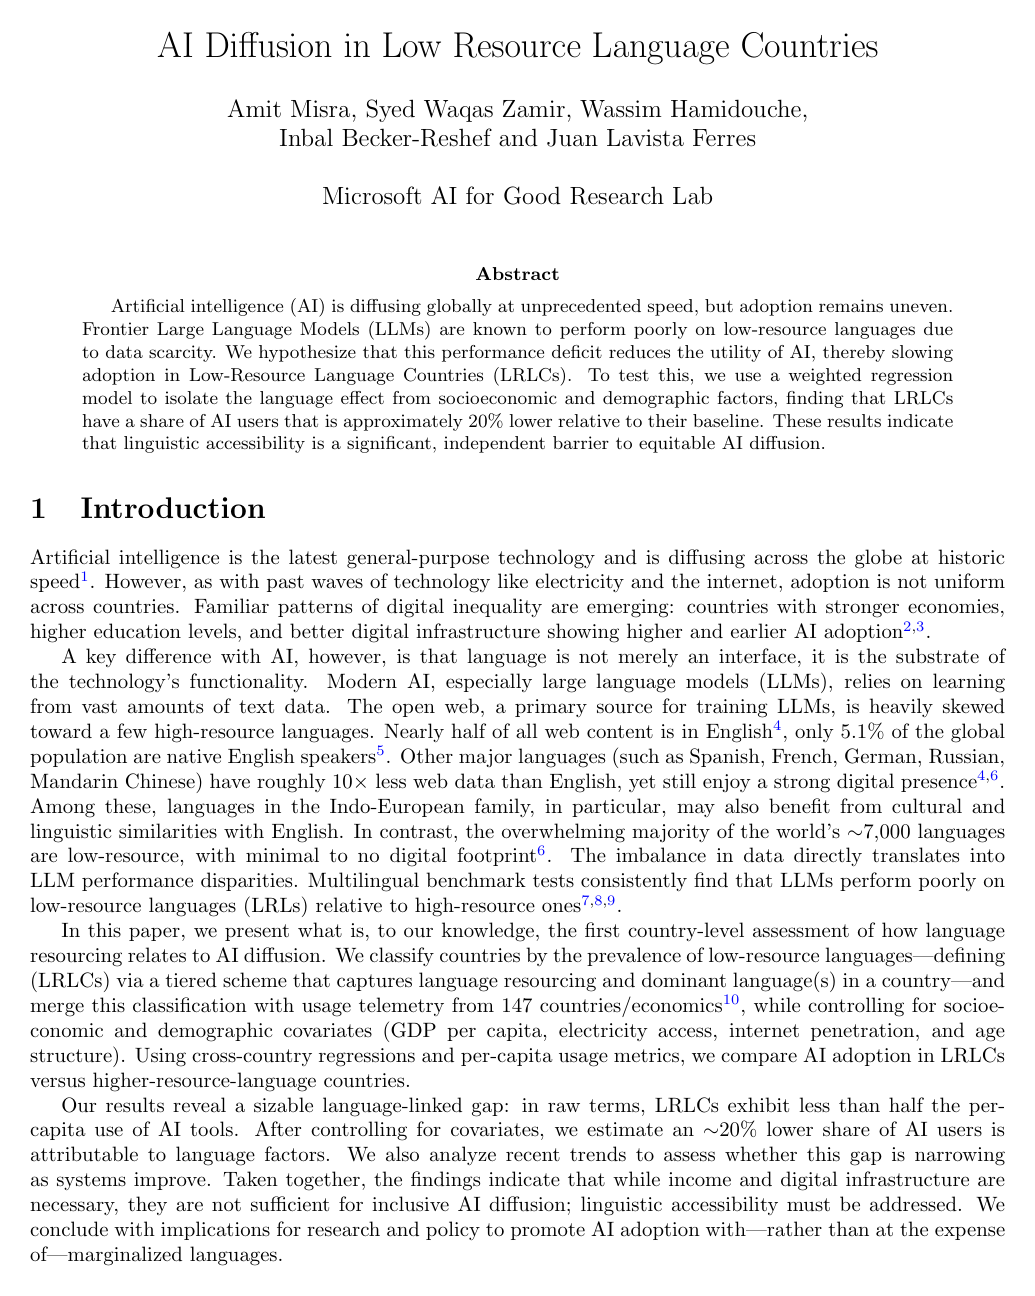
AI Diffusion in Low Resource Language Countries

Amit MisraSyed Waqas ZamirWassim HamidoucheInbal Becker-ReshefJuan M. Lavista Ferres

article2025arXiv2 citationsBest Paper Award at the AAAI-26 Bridge Program on AI for Medicine

Demonstrates that low-resource language countries suffer a twenty percent reduction in artificial intelligence adoption rates, isolating linguistic accessibility as an independent barrier to global technology diffusion.

Listen

Artificial intelligence is expanding globally at a rapid pace, yet its adoption varies widely across nations. While past digital divides have been driven by economic and infrastructural gaps, modern generative AI relies heavily on large language models that depend on vast quantities of online text. Because digital text is overwhelmingly concentrated in a few high-resource languages, models perform significantly worse in low-resource languages, creating a potential barrier to AI adoption for non-English and underrepresented language communities.

The article aims to evaluate whether language resourcing independently drives country-level AI adoption and to quantify the adoption gap between Low-Resource Language Countries and countries with higher-resource languages.

To conduct this evaluation, the authors built a taxonomy classifying languages into high, mid, and low resources based on digital presence and model performance, assigning readiness labels to countries using dominant national language data. They merged this taxonomy with AI tool usage telemetry across 147 countries, controlling for key socioeconomic and demographic factors, including gross domestic product per capita, electricity access, internet penetration, and population age structure. The analysis used weighted regression models and difference-in-differences estimators to isolate the specific impact of language availability.

The findings show that raw AI user share in Low-Resource Language Countries is less than half that of other nations, recording 9.9% in 2025 compared to 21.3% for non-low-resource countries. After controlling for income and infrastructure, Low-Resource Language Countries still face an estimated 2.1 percentage point adoption deficit, representing an approximate 20% shortfall relative to their baseline adoption rate. Furthermore, longitudinal analysis shows no statistically significant widening or narrowing of this gap between 2024 and 2025, indicating that the disparity is persistent rather than closing naturally.

These results demonstrate that economic growth and digital infrastructure alone are insufficient to guarantee inclusive technological diffusion; linguistic accessibility operates as an independent obstacle. Without intervention, populations speaking low-resource languages risk exclusion from AI productivity benefits, compounding existing global economic disparities.

The article concludes that closing this adoption gap requires direct action to build high-quality digital training datasets for low-resource languages, as technological workarounds cannot replace sufficient data. Research and policy initiatives must prioritize multilingual data collection to make AI accessible across linguistic boundaries.

Confidence in these findings is supported by consistent results across multiple statistical weighting and regression models. However, readers should consider certain limitations: country-level language classification is complicated by widespread multilingualism and subnational literacy or urban-rural disparities, and the one-year dataset offers a limited time horizon that requires longer-term monitoring.

arXiv: 2511.02752
Cover for AI Diffusion in Low Resource Language Countries

Abstract

Artificial intelligence (AI) is diffusing globally at unprecedented speed, but adoption remains uneven. Frontier Large Language Models (LLMs) are known to perform poorly on low-resource languages due to data scarcity. We hypothesize that this performance deficit reduces the utility of AI, thereby slowing adoption in Low-Resource Language Countries (LRLCs). To test this, we use a weighted regression model to isolate the language effect from socioeconomic and demographic factors, finding that LRLCs have a share of AI users that is approximately 20% lower relative to their baseline. These results indicate that linguistic accessibility is a significant, independent barrier to equitable AI diffusion.

Table of Contents

  • 1 Introduction
  • 2 Methods
  • 2.1 Defining Low Resource Language Countries
  • 2.1.1 Language Classification
  • 2.1.2 Country-Level Classification
  • 2.2 Estimating the Impact of Low-Resource Languages on AI Diffusion
  • 3 Results
  • 4 Discussion and Conclusions
  • References
  • Appendix

Knowls

  1. Knowl 1 — Adjusted AI Adoption Deficit and Counterfactuals in Low-Resource Language Countries

    empirical result

    After controlling for socioeconomic and demographic covariates (log-transformed GDP per capita, electricity access, internet access, and population age structure), countries classified as Low-Resource Language Countries (LRLCs) exhibit a statistically significant deficit in AI user adoption relative to higher-resource language countries.

    In 2025, the baseline AI user adoption rate for LRLCs was 10.010.0 percentage points (pp). Conditioning on covariates, the estimated adoption gap attributable to low-resource language status was 2.1 pp2.1\text{ pp}, yielding an estimated counterfactual adoption rate of 12.1 pp12.1\text{ pp} (95%95\% CI: [10.4,13.8] pp[10.4, 13.8]\text{ pp}) if language constraints were removed. This represents an estimated relative adoption shortfall of 21%21\% (95%95\% CI: [4,38]%[4, 38]\%).

    Year LRLC Baseline (pp) Gap Estimate (pp) Counterfactual (pp) Relative Impact (%)
    Point Est. 95% CI Point Est. 95% CI
    2025 10.0 2.1 12.1 [10.4, 13.8] 21 [4, 38]
    2024 8.6 1.2 9.8 [8.3, 11.4] 14 [-4, 33]
    • LRLC Baseline: The observed percentage of the working-age population using AI tools in LRLCs.
    • Gap Estimate: The estimated Average Treatment Effect on the Treated (ATT) representing the adoption deficit in percentage points.
    • Counterfactual: The estimated adoption rate that LRLCs would achieve in the absence of language constraints (calculated as LRLC Baseline+Gap Estimate\text{LRLC Baseline} + \text{Gap Estimate}).
    • Relative Impact: The treatment effect expressed as a percentage of the LRLC baseline adoption rate.
  2. Knowl 2 — Econometric Estimation Strategy for Language-Driven AI Diffusion Gaps

    model/method

    To evaluate the relationship between low-resource language prevalence and AI adoption across 147 countries, the outcome metric AI User Share (the estimated proportion of a country's working-age population using AI tools) is modeled using observational causal inference methods conditioned on socioeconomic and demographic covariates.

    The primary estimator is a fractional logit Generalized Linear Model (GLM) weighted to recover the Average Treatment Effect on the Treated (ATT):

    τATT=E[Y(1)−Y(0)∣D=1]\tau_{\text{ATT}} = \mathbb{E}[Y(1) - Y(0) \mid D=1]

    where Y∈[0,1]Y \in [0, 1] is the AI User Share, D∈{0,1}D \in \{0, 1\} is the indicator for Low-Resource Language Country (LRLC) status, and Y(1),Y(0)Y(1), Y(0) denote potential adoption outcomes under LRLC and non-LRLC status, respectively.

    All models adjust for a covariate vector XX consisting of:

    1. Log-transformed GDP per capita
    2. Electricity access rate (% of population)
    3. Internet access rate (% of population)
    4. Population age structure distribution

    Continuous covariates are standardized before propensity score estimation. Propensity scores e(X)=P(D=1∣X)e(X) = P(D=1 \mid X) are estimated via L2L_2-regularized logistic regression and clipped to [0.02,0.98][0.02, 0.98] to prevent extreme weights. Inference is conducted via stratified bootstrap at the country level with 1,000 resamples to construct 95% percentile confidence intervals, alongside HC3 robust standard errors for linear and GLM models.

  3. Knowl 3 — Cross-Estimator Comparison of Low-Resource Language Impact on AI Adoption

    empirical result

    The negative effect of Low-Resource Language Country (LRLC) status on AI User Share is robust across multiple econometric model specifications and weighting strategies.

    Method Estimate (pp) Std. Error 95% CI ESS
    OLS -1.88 0.96 [-3.77, 0.01] –
    ATT (IPW) -2.32 0.80 [-3.89, -0.75] 21.1
    ATT (AIPW) -1.69 0.91 [-3.48, 0.09] 21.1
    ATT-weighted GLM -2.07 0.86 [-3.76, -0.38] 21.1
    • OLS: Standard ordinary least squares regression with HC3 robust standard errors.
    • ATT (IPW): Inverse Probability Weighting targeted at the Average Treatment Effect on the Treated.
    • ATT (AIPW): Doubly robust Augmented Inverse Probability Weighting combining propensity weighting with outcome regression.
    • ATT-weighted GLM: Fractional logit Generalized Linear Model weighted to estimate the ATT.
    • ESS: Kish effective sample size for the control group (ESS=21.1ESS = 21.1).

    Point estimates consistently indicate an adoption penalty between −1.69 pp-1.69\text{ pp} and −2.32 pp-2.32\text{ pp} for LRLCs, showing that language resourcing acts as an independent barrier to adoption beyond physical and economic infrastructure.

  4. Knowl 4 — Country-Level AI Diffusion Readiness Taxonomy

    model/method

    Countries are categorized into three AI diffusion readiness tiers using a two-stage linguistic classification process based on web text availability (from corpora such as FineWeb2), frontier LLM performance, and CIA World Factbook records:

    1. Language Resource Taxonomy:

      • High-Resource Languages: Languages with vast online digital presence and strong representation in LLMs (e.g., English, Spanish, French, German, Italian, Russian, Portuguese, Mandarin Chinese, Japanese).
      • Mid-Resource Languages: Languages with moderate online digital text, where LLMs perform reasonably but with lower accuracy than in high-resource languages (e.g., Arabic, Hindi, Bengali, Polish, Dutch, Indonesian, Vietnamese, Persian, Turkish, Thai, Korean, Ukrainian, Greek, Czech, Swedish, Hungarian, Danish, Finnish, Hebrew, Malay).
      • Low-Resource Languages: Languages with minimal or no textual digital footprints, comprising the majority of the world's ~7,000 languages (e.g., Chichewa, Inuktitut, Guarani).
    2. Country Categorization Protocol:

      • Language Parsing: Unstructured text in the languages field of the CIA World Factbook is parsed using a GPT-5 reasoning model to extract each country's dominant national language.
      • Resource Mapping: A country is assigned to High-Resource Language Country (HRLC) status if its dominant language is high-resource; Mid-Resource Language Country (MRLC) status if its dominant language is mid-resource; and defaults to Low-Resource Language Country (LRLC) status otherwise.
  5. Knowl 5 — Disparity in Unadjusted AI Adoption Rates Across Language Categories

    empirical result

    Observational usage telemetry across 147 countries indicates that unadjusted AI User Share in Low-Resource Language Countries (LRLCs) is less than half that of non-LRLCs, with lower absolute and relative growth between 2024 and 2025.

    Language Category AI User Share (2024) AI User Share (2025) Relative Change
    non-LRLCs 17.2% 21.3% 23%
    LRLCs 8.5% 9.9% 17%
    • AI User Share: The proportion of the working-age population using AI tools in each country group.
    • Relative Change: The within-group percentage increase in AI User Share from 2024 to 2025, computed as Share2025−Share2024Share2024×100\frac{\text{Share}_{2025} - \text{Share}_{2024}}{\text{Share}_{2024}} \times 100.

    In raw terms, non-LRLC user share grew by 4.1 percentage points4.1\text{ percentage points} (+23%+23\% relative increase), whereas LRLC user share grew by 1.4 percentage points1.4\text{ percentage points} (+17%+17\% relative increase).

  6. Knowl 6 — Temporal Stability of the Linguistic AI Diffusion Divide (2024–2025)

    empirical result

    A two-period panel Difference-in-Differences (DiD) model was estimated to test whether the AI diffusion gap between Low-Resource Language Countries (LRLCs) and non-LRLCs widened or narrowed between 2024 and 2025.

    Using a doubly robust Augmented Inverse Probability Weighting (AIPW-DiD) estimator that combines pre-period covariate weighting with outcome regression:

    • The estimated change in the treatment effect over time was +0.08 percentage points+0.08\text{ percentage points} (95%95\% CI: [−1.21,2.00] pp[-1.21, 2.00]\text{ pp}).
    • Because the confidence interval spans zero, there is no statistically significant evidence that the adoption gap widened or narrowed over this period.
    • Robustness checks using an IPW-DiD estimator yielded directionally consistent results, and balance diagnostics confirmed acceptable covariate overlap with post-weighting standardized mean differences satisfying ∣SMD∣<0.1|\text{SMD}| < 0.1.

    These results suggest that observed increases in raw gap metrics reflect common macroeconomic and technological diffusion trends across both groups rather than a widening causal divide.

  7. Knowl 7 — Limitations in Country-Level Linguistic AI Diffusion Modeling

    limitation

    The methodology for assessing country-level AI adoption gaps faces three primary limitations:

    1. Multilingualism and Secondary Language Adoption: Assigning a single dominant language tier per country overlooks multilingual populations. Reliable cross-country data on second-language proficiency (e.g., English literacy among non-native speakers) is largely unavailable, potentially misattributing adoption outcomes.
    2. Intra-Country Literacy and Urban-Rural Heterogeneity: Country-level aggregation fails to capture internal variations. Low literacy rates can constrain AI adoption even within countries with high-resource official languages, and substantial disparities exist between major metropolitan centers and rural areas.
    3. Limited Temporal Horizon: The study relies on a one-year longitudinal window (2024 to 2025), which is insufficient to determine long-term trajectory patterns (such as whether the adoption gap will ultimately converge or expand as frontier LLMs evolve).

Coverage note — Appendix Table 4 (the exhaustive country-by-country list of 147 AI diffusion classifications) was omitted because the classification methodology is fully captured in the country taxonomy knowl.

References

  1. 1.Alexander Bick, Adam Blandin, and David J Deming. The rapid adoption of generative AI. Tech. rep. National Bureau of Economic Research, 2024.
  2. 2.Muhammad Salar Khan, Hamza Umer, and Farhana Faruqe. “Artificial intelligence for low income countries”. In: Humanities and Social Sciences Communications 11.1 (Oct. 2024). Publisher: Palgrave, pp. 1–13. issn: 2662-9992. doi: 10.1057/s41599- 024- 03947- w. url: https://www.nature.com/articles/s41599-024-03947-w.
  3. 3.Yan Liu and He Wang. Who on Earth Is Using Generative AI ? Washington, DC: World Bank, Aug. 2024. doi: 10.1596/1813-9450-10870. url: https://hdl.handle.net/10986/42071.
  4. 4.Common Crawl. Distribution of Languages. Accessed: 2025-09-12. 2025. url: https://commoncrawl.github.io/cc-crawl-statistics/plots/languages.
  5. 5.Central Intelligence Agency. The World Factbook: World. Accessed 2025-09-12. 2025. url: https ://www.cia.gov/the-world-factbook/countries/world/.
  6. 6.Guilherme Penedo et al. FineWeb2: One Pipeline to Scale Them All – Adapting Pre-Training Data Processing to Every Language. 2025. arXiv: 2506.20920 [cs.CL]. url: https://arxiv.org/abs/2506.20920.
  7. 7.Alessio Buscemi et al. Mind the Language Gap: Automated and Augmented Evaluation of Bias in LLMs for High- and Low-Resource Languages. 2025. url: https://arxiv.org/abs/2504.18560.
  8. 8.Shivalika Singh et al. Global MMLU: Understanding and Addressing Cultural and Linguistic Biases in Multilingual Evaluation. 2025. url: https://arxiv.org/abs/2412.03304.
  9. 9.David Ifeoluwa Adelani et al. IrokoBench: A New Benchmark for African Languages in the Age of Large Language Models. 2025. url: https://arxiv.org/abs/2406.03368.
  10. 10.Amit Misra and Jane Wang et al. Measuring AI Diffusion: A Population-Normalized Metric for Tracking Global AI Usage. Tech. rep. Microsoft AI for Good Lab, 2025. url: https : / / aka . ms / AI _Diffusion_Technical_Report.
  11. 11.CIA World Factbook. https://www.cia.gov/the-world-factbook/. 2025.
  12. 12.Leslie E. Papke and Jeffrey M. Wooldridge. “Econometric Methods for Fractional Response Variables with an Application to 401(k) Plan Participation Rates”. In: Journal of Applied Econometrics 11.6 (1996), pp. 619–632. doi: 10.1002/(SICI)1099-1255(199611)11:6<619::AID-JAE418>3.0.CO;2-1.
  13. 13.World Bank. World Bank Open Data. url: https://data.worldbank.org.
  14. 14.International Energy Agency (IEA) et al. Tracking SDG7: The energy progress report, 2023. Tech. rep. Paris and Washington, DC: IEA, IRENA, UNSD, World Bank, WHO, 2023. url: https://www.iea.org/reports/tracking-sdg7-the-energy-progress-report-2023.
  15. 15.International Telecommunication Union (ITU). Individuals using the Internet (% of population). ITU DataHub. url: https://datahub.itu.int/data/?i=11624.
  16. 16.Keisuke Hirano, Guido W. Imbens, and Geert Ridder. Efficient Estimation of Average Treatment Effects Using the Estimated Propensity Score. Technical Working Paper 251. NBER, 2000. url: https://www.nber.org/system/files/working_papers/t0251/t0251.pdf.
  17. 17.Adam N. Glynn and Kevin M. Quinn. “An Introduction to the Augmented Inverse Propensity Weighted Estimator”. In: Political Analysis 18.1 (2010), pp. 36–56. url: https://www.law.berkeley.edu/files/AIPW(1).pdf.
  18. 18.Christoph F. Kurz. “Augmented Inverse Probability Weighting and the Double Robustness Property”. In: Medical Decision Making 42.2 (2022), pp. 156–167. doi: 10 . 1177 / 0272989X211027181. url: https://europepmc.org/article/pmc/8793316.
  19. 19.Bradley Efron. “Bootstrap Methods: Another Look at the Jackknife”. In: The Annals of Statistics 7.1 (1979), pp. 1–26. doi: 10.1214/aos/1176344552.
  20. 20.Pedro H. C. Sant’Anna and Jun B. Zhao. “Doubly Robust Difference-in-Differences Estimators”. In: Journal of Econometrics 219.1 (2020), pp. 101–122. url: https://arxiv.org/pdf/1812.01723.
  21. 21.Peter C. Austin. “An Introduction to Propensity Score Methods for Reducing the Effects of Confounding in Observational Studies”. In: Multivariate Behavioral Research 46.3 (2011), pp. 399–424. doi: 10.1080/00273171.2011.568786.
  22. 22.Leslie Kish. Survey Sampling. Wiley, 1965.

Citation

MLA
Misra, A., et al. “AI Diffusion in Low Resource Language Countries”. arXiv, 2025, http://arxiv.org/abs/2511.02752v1.
APA
Misra, A., Zamir, S. W., Hamidouche, W., Becker-Reshef, I., & Ferres, J. L. (2025). AI Diffusion in Low Resource Language Countries. arXiv. http://arxiv.org/abs/2511.02752v1
Chicago
Misra, A., S. W. Zamir, W. Hamidouche, I. Becker-Reshef, and J. L. Ferres. 2025. “AI Diffusion in Low Resource Language Countries”. arXiv. http://arxiv.org/abs/2511.02752v1.
Harvard
Misra, A. et al. (2025) “AI Diffusion in Low Resource Language Countries”, arXiv [Preprint]. Available at: http://arxiv.org/abs/2511.02752v1.
Vancouver
1. Misra A, Zamir SW, Hamidouche W, Becker-Reshef I, Ferres JL (2025) AI Diffusion in Low Resource Language Countries. arXiv

BibTeX

@article{misra2025diffusion,
  title = {AI Diffusion in Low Resource Language Countries},
  author = {Misra, Amit and Zamir, Syed Waqas and Hamidouche, Wassim and Becker-Reshef, Inbal and Ferres, Juan Lavista},
  year = {2025},
  journal = {arXiv},
  url = {http://arxiv.org/abs/2511.02752v1},
  eprint = {2511.02752}
}
Metadata:arXiv

Access the Paper

This paper is available from its original source. Click below to access the PDF.

Open PDF
License: https://creativecommons.org/licenses/by/4.0/