Pitfalls of Graph Neural Network Evaluation

Oleksandr ShchurMaximilian MummeAleksandar BojchevskiStephan Günnemann

article2018arXiv1,875 citations

Demonstrates how standard graph neural network benchmarks produce misleading model comparisons through rigid data splits and inconsistent training setups, revealing that simpler architectures often outperform complex ones under fair evaluation.

Listen

Graph Neural Networks (GNNs)—machine learning models designed to classify interconnected data such as social networks, scientific literature, and e-commerce platforms—have seen rapid development and widespread adoption. However, assessing actual progress in the field has become unreliable. Many newly proposed architectures rely on flawed benchmarking practices, primarily testing on identical, single data splits and using inconsistent training procedures across models. This practice risks mistaking overfitted setups and tuning advantages for genuine architectural breakthroughs.

To establish a rigorous baseline, the article evaluated four leading GNN architectures (GCN, MoNet, GAT, and GraphSAGE) alongside four traditional baselines to assess how standardized training conditions and varied data splits impact model performance and rankings. The authors developed a unified benchmarking framework that enforces identical optimization rules, early-stopping criteria, and hyperparameter tuning protocols across all models. Testing was conducted across eight distinct graph datasets—comprising four established citation networks and four newly introduced co-authorship and co-purchase networks—evaluated over 100 random data splits with 20 random weight initializations per split.

The findings reveal that model rankings are highly fragile when evaluated on single data splits. Testing on the standard single benchmark split ranked GAT highest on two datasets, but evaluating the exact same models on a different random split completely inverted the rankings, placing GCN first. When aggregated across all splits and datasets, all GNN architectures significantly outperformed non-graph baselines, but simpler architectures proved superior to more complex ones: the simpler GCN model achieved the highest overall relative accuracy (99.4%) and best average rank (2.3), outperforming more sophisticated models like GAT (95.9% relative accuracy, rank 3.6). Additionally, the evaluation uncovered stability risks; for instance, GAT suffered severe performance drops (falling below 40% accuracy) on specific random weight initializations in certain datasets, showing high variance despite comparable median performance.

These results demonstrate that the perceived performance gains of increasingly complex graph architectures are often artifacts of specific data splits or hyperparameter tuning rather than architectural superiority. For organizations deploying machine learning on relational data, adopting complex models introduces unnecessary engineering overhead, compute costs, and operational risk when simpler, well-tuned models achieve equivalent or better generalization.

Organizations and practitioners evaluating or implementing graph-based models should immediately abandon single-split evaluations in favor of robust, multi-split benchmarks with unified hyperparameter tuning. When selecting models for production, decision-makers should default to simpler architectures like GCN as primary baselines before adopting complex mechanisms like graph attention. Future research and development should focus on investigating specific graph structural properties that drive performance differences across diverse domain applications.

The conclusions provide high confidence regarding the necessity of multi-split benchmarking and standardized training within the evaluated conditions. However, users should note that the evaluation was restricted to transductive semi-supervised node classification using two-layer architectures and fixed training sample sizes (20 labeled nodes per class), meaning findings should be validated separately if applying models to inductive tasks or distinct operational scales.

  • Paper: Open Graph Benchmark: Datasets for Machine Learning on Graphs, Weihua Hu et al. (2020). Open Graph Benchmark addresses the benchmarking and data-split pitfalls identified in the source by establishing realistic, large-scale standardized datasets and split strategies.
  • Paper: Predict then Propagate: Graph Neural Networks meet Personalized PageRank, Johannes Gasteiger et al. (2019). This work directly responds to GNN evaluation pitfalls by adopting rigorous evaluation protocols (100 random splits, bootstrap confidence intervals) and showing that decoupled propagation outperforms complex architectures.
  • Paper: Simplifying Graph Convolutional Networks, Felix Wu et al. (2019). This paper validates the source's finding that simpler models can outperform sophisticated ones by demonstrating that removing non-linearities from GCNs yields competitive performance at lower computational cost.
  • Paper: How Powerful are Graph Neural Networks?, Keyulu Xu et al. (2019). This work establishes a formal theoretical framework to analyze the expressive capacity of GNN architectures beyond empirical benchmark rankings.
  • Paper: Fast Graph Representation Learning with PyTorch Geometric, Matthias Fey et al. (2019). PyTorch Geometric implements standardized implementations and benchmarking splits across dozens of graph architectures, directly addressing the reproducibility challenges highlighted in the source.
  • Paper: Simple and Deep Graph Convolutional Networks, Ming Chen et al. (2020). This paper explores deep GCN architectures using rigorous experimental protocols that guard against the hyperparameter and split-dependent pitfalls identified in the source.
  • Paper: Analyzing Learned Molecular Representations for Property Prediction, Kevin Yang et al. (2019). This work examines the impact of scaffold and chronological data splitting methodologies on molecular GNN evaluation, confirming the critical role of split design on model rankings.
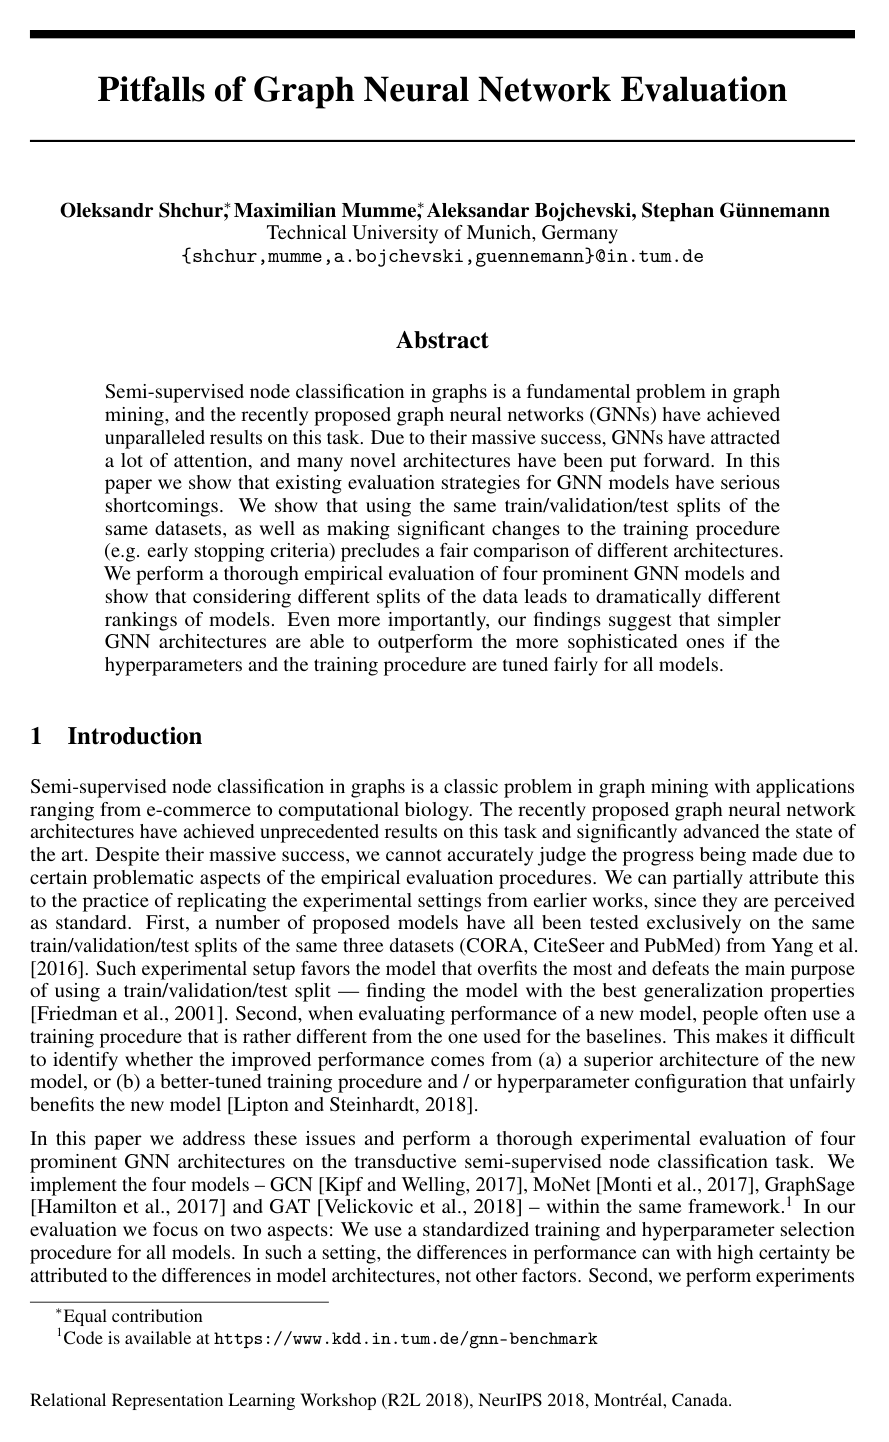
Cover for Pitfalls of Graph Neural Network Evaluation

Abstract

Semi-supervised node classification in graphs is a fundamental problem in graph mining, and the recently proposed graph neural networks (GNNs) have achieved unparalleled results on this task. Due to their massive success, GNNs have attracted a lot of attention, and many novel architectures have been put forward. In this paper we show that existing evaluation strategies for GNN models have serious shortcomings. We show that using the same train/validation/test splits of the same datasets, as well as making significant changes to the training procedure (e.g. early stopping criteria) precludes a fair comparison of different architectures. We perform a thorough empirical evaluation of four prominent GNN models and show that considering different splits of the data leads to dramatically different rankings of models. Even more importantly, our findings suggest that simpler GNN architectures are able to outperform the more sophisticated ones if the hyperparameters and the training procedure are tuned fairly for all models.

Table of Contents

  • 1 Introduction
  • 2 Models
  • 3 Evaluation
  • 4 Conclusion
  • References
  • A Differences in training procedures for GNN models
  • B Datasets description and statistics
  • C Hyperparameter configurations and Early Stopping
  • D Performance of different models across datasets

Knowls

  1. Knowl 1 — Standardized Training and Evaluation Protocol for Transductive Graph Neural Networks

    experimental setup

    To evaluate semi-supervised transductive node classification fairly without bias introduced by differing optimization tricks, a standardized training and evaluation procedure is defined:

    1. Data Splitting: For each dataset, 100 random train/validation/test splits are generated. Each split allocates 20 labeled nodes per class for training, 30 labeled nodes per class for validation, and the remaining nodes for testing.
    2. Repetitions: For each split, 20 random parameter initializations are performed (yielding 2,000 runs per model per dataset).
    3. Architecture: All models use a 2-layer structure (input →\rightarrow hidden layer →\rightarrow output layer).
    4. Optimization & Initialization: All models are optimized using the Adam optimizer with default parameters, weights initialized via Glorot/Xavier initialization, biases initialized to zero, and trained in full-batch mode without learning rate decay.
    5. Simultaneous Parameter Optimization: All parameters (including attention weights in GAT and Gaussian kernel parameters in MoNet) are trained simultaneously.
    6. Unified Early Stopping: Training runs for a maximum of 100,000 epochs, but stops if the total validation loss (data cross-entropy loss plus L2L_2 regularization loss) does not decrease for 50 consecutive epochs. The model weights are then restored to the checkpoint corresponding to the minimum validation loss.
  2. Knowl 2 — Data Split Sensitivity and Model Ranking Fragility in GNN Evaluation

    empirical result

    Evaluating Graph Neural Networks (GNNs) on a single train/validation/test split produces fragile and misleading rankings. When evaluated on the fixed Planetoid split (from Yang et al., 2016) versus an alternative random split of identical size (20 training nodes per class, 500 validation nodes, 1000 test nodes), the relative ranking of model architectures completely flips:

    Planetoid split CORA CiteSeer PubMed
    GCN 81.9±0.881.9 \pm 0.8 69.5±0.969.5 \pm 0.9 79.0±0.5\mathbf{79.0 \pm 0.5}
    GAT 82.8±0.5\mathbf{82.8 \pm 0.5} 71.0±0.6\mathbf{71.0 \pm 0.6} 77.0±1.377.0 \pm 1.3
    MoNet 82.2±0.782.2 \pm 0.7 70.0±0.670.0 \pm 0.6 77.7±0.677.7 \pm 0.6
    GS-maxpool 77.4±1.077.4 \pm 1.0 67.0±1.067.0 \pm 1.0 76.6±0.876.6 \pm 0.8
    Another split CORA CiteSeer PubMed
    GCN 79.0±0.7\mathbf{79.0 \pm 0.7} 68.6±1.1\mathbf{68.6 \pm 1.1} 69.5±1.069.5 \pm 1.0
    GAT 77.9±0.777.9 \pm 0.7 67.7±1.267.7 \pm 1.2 69.5±0.669.5 \pm 0.6
    MoNet 77.9±0.777.9 \pm 0.7 66.8±1.366.8 \pm 1.3 70.7±0.5\mathbf{70.7 \pm 0.5}
    GS-maxpool 74.5±0.674.5 \pm 0.6 63.1±1.263.1 \pm 1.2 70.3±0.870.3 \pm 0.8

    On the standard Planetoid split, GAT achieves the best performance on CORA and CiteSeer, whereas GCN achieves the best performance on PubMed. On the alternative split, GCN ranks first on CORA and CiteSeer, and MoNet ranks first on PubMed. This demonstrates that performance gains observed on a single fixed split can reflect split-specific overfitting rather than architectural superiority.

  3. Knowl 3 — Empirical Performance of GNNs and Baselines Across Eight Benchmark Datasets

    data/table

    Mean test set accuracy (percentage ±\pm standard deviation) evaluated over 100 random splits with 20 random initializations per split (2,000 total runs per model per dataset, except GS-maxpool on Amazon Computers due to GPU memory constraints):

    Model CORA CiteSeer PubMed CORA-Full
    GCN 81.5±1.381.5 \pm 1.3 71.9±1.9\mathbf{71.9 \pm 1.9} 77.8±2.977.8 \pm 2.9 62.2±0.6\mathbf{62.2 \pm 0.6}
    GAT 81.8±1.3\mathbf{81.8 \pm 1.3} 71.4±1.971.4 \pm 1.9 78.7±2.3\mathbf{78.7 \pm 2.3} 51.9±1.551.9 \pm 1.5
    MoNet 81.3±1.381.3 \pm 1.3 71.2±2.071.2 \pm 2.0 78.6±2.378.6 \pm 2.3 59.8±0.859.8 \pm 0.8
    GS-mean 79.2±7.779.2 \pm 7.7 71.6±1.971.6 \pm 1.9 77.4±2.277.4 \pm 2.2 58.6±1.658.6 \pm 1.6
    GS-maxpool 76.6±1.976.6 \pm 1.9 67.5±2.367.5 \pm 2.3 76.1±2.376.1 \pm 2.3 40.7±1.540.7 \pm 1.5
    GS-meanpool 77.9±2.477.9 \pm 2.4 68.6±2.468.6 \pm 2.4 76.5±2.476.5 \pm 2.4 40.5±1.540.5 \pm 1.5
    MLP 58.2±2.158.2 \pm 2.1 59.1±2.359.1 \pm 2.3 70.0±2.170.0 \pm 2.1 36.8±1.036.8 \pm 1.0
    LogReg 57.1±2.357.1 \pm 2.3 61.0±2.261.0 \pm 2.2 64.1±3.164.1 \pm 3.1 40.5±0.840.5 \pm 0.8
    LabelProp 74.4±2.674.4 \pm 2.6 67.8±2.167.8 \pm 2.1 70.5±5.370.5 \pm 5.3 50.5±1.550.5 \pm 1.5
    LabelProp NL 73.9±1.673.9 \pm 1.6 66.7±2.266.7 \pm 2.2 72.3±2.972.3 \pm 2.9 51.0±1.051.0 \pm 1.0
    Model Coauthor CS Coauthor Physics Amazon Computers Amazon Photo
    GCN 91.1±0.591.1 \pm 0.5 92.8±1.092.8 \pm 1.0 82.6±2.482.6 \pm 2.4 91.2±1.291.2 \pm 1.2
    GAT 90.5±0.690.5 \pm 0.6 92.5±0.992.5 \pm 0.9 78.0±19.078.0 \pm 19.0 85.7±20.385.7 \pm 20.3
    MoNet 90.8±0.690.8 \pm 0.6 92.5±0.992.5 \pm 0.9 83.5±2.2\mathbf{83.5 \pm 2.2} 91.2±1.391.2 \pm 1.3
    GS-mean 91.3±2.8\mathbf{91.3 \pm 2.8} 93.0±0.8\mathbf{93.0 \pm 0.8} 82.4±1.882.4 \pm 1.8 91.4±1.3\mathbf{91.4 \pm 1.3}
    GS-maxpool 85.0±1.185.0 \pm 1.1 90.3±1.290.3 \pm 1.2 N/A 90.4±1.390.4 \pm 1.3
    GS-meanpool 89.6±0.989.6 \pm 0.9 92.6±1.092.6 \pm 1.0 79.9±2.379.9 \pm 2.3 90.7±1.690.7 \pm 1.6
    MLP 88.3±0.788.3 \pm 0.7 88.9±1.188.9 \pm 1.1 44.9±5.844.9 \pm 5.8 69.6±3.869.6 \pm 3.8
    LogReg 86.4±0.986.4 \pm 0.9 86.7±1.586.7 \pm 1.5 64.1±5.764.1 \pm 5.7 73.0±6.573.0 \pm 6.5
    LabelProp 73.6±3.973.6 \pm 3.9 86.6±2.086.6 \pm 2.0 70.8±8.170.8 \pm 8.1 72.6±11.172.6 \pm 11.1
    LabelProp NL 76.7±1.476.7 \pm 1.4 86.8±1.486.8 \pm 1.4 75.0±2.975.0 \pm 2.9 83.9±2.783.9 \pm 2.7

    Key observations:

    1. All GNN variants significantly outperform feature-only baselines (MLP, Logistic Regression) and graph-structure-only baselines (Label Propagation, Normalized Laplacian Label Propagation).
    2. No single GNN architecture universally outperforms the others; on 5 of the 8 datasets, the 2nd and 3rd best architectures perform within 1% of the top architecture.
    3. Simpler architectures like GCN perform on par with or better than more complex models (such as GAT and MoNet) when hyperparameters and training pipelines are standardized.
  4. Knowl 4 — Overall Relative Accuracy and Model Ranks Across Benchmark Datasets

    empirical result

    To evaluate overall performance without privileging any single dataset, each model is measured by relative accuracy and average rank:

    • Relative Accuracy: For each split of each dataset, the highest average accuracy across 20 weight initializations is set to 100%100\%. Every model's accuracy is scaled relative to this top score, and the resulting percentages are averaged across all splits and datasets.
    • Average Rank: Models are ranked from 1 (best) to 10 (worst) on each split, and ranks are averaged across all datasets and splits.
    Model Relative accuracy (%) Average rank
    GCN 99.4 2.3
    MoNet 99.0 2.7
    GS-mean 98.3 2.7
    GAT 95.9 3.6
    GS-meanpool 93.0 5.2
    GS-maxpool 91.1 6.4
    LabelProp NL 89.3 7.4
    LabelProp 86.6 7.7
    LogReg 80.6 8.8
    MLP 77.8 8.8

    Under unified training and hyperparameter search conditions, GCN achieves the highest relative accuracy (99.4%99.4\%) and the lowest (best) average rank (2.32.3).

  5. Knowl 5 — Characteristics of the Eight Evaluated Graph Benchmark Datasets

    data/table

    Experiments are conducted on eight graph datasets. All graphs are treated as undirected, restricted to their largest connected component, and augmented with self-loops. For CORA-Full, classes with fewer than 50 nodes are removed to allow 20/30/rest splits.

    Dataset Classes Features Nodes Edges Label rate Edge density
    CORA 7 1433 2485 5069 0.0563 0.0004
    CiteSeer 6 3703 2110 3668 0.0569 0.0004
    PubMed 3 500 19717 44324 0.0030 0.0001
    CORA-Full 67 8710 18703 62421 0.0745 0.0001
    Coauthor CS 15 6805 18333 81894 0.0164 0.0001
    Coauthor Physics 5 8415 34493 247962 0.0029 0.0001
    Amazon Computers 10 767 13381 245778 0.0149 0.0007
    Amazon Photo 8 745 7487 119043 0.0214 0.0011
    • Label rate: Fraction of nodes in the training set, computed as (#classes×20)/#nodes(\text{\#classes} \times 20) / \text{\#nodes}.
    • Edge density: Fraction of all possible edges present in the graph, computed as #edges/(12⋅#nodes2)\text{\#edges} / (\frac{1}{2} \cdot \text{\#nodes}^2).
    • Coauthor CS / Physics: Co-authorship graphs from the Microsoft Academic Graph (KDD Cup 2016); nodes are authors, edges connect co-authors, features are paper keywords, labels are primary study fields.
    • Amazon Computers / Photo: Co-purchase graphs; nodes represent products, edges represent frequently co-purchased items, features are bag-of-words from reviews, labels are product categories.
  6. Knowl 6 — Initialization Instability and Outlier Failures in Graph Attention Networks

    empirical result

    On the Amazon Computers and Amazon Photo datasets, Graph Attention Networks (GAT) exhibit high variance in test accuracy (78.0±19.0%78.0 \pm 19.0\% on Computers, 85.7±20.3%85.7 \pm 20.3\% on Photo).

    While GAT's median accuracy is closely aligned with GCN, MoNet, and GraphSAGE, GAT experiences severe initialization-dependent degradation on certain runs, collapsing to accuracy scores below 40%40\%. Specifically on Amazon Photo, this catastrophic failure occurs in 138 out of 2,000 runs (6.9%6.9\% of runs across splits and initializations), heavily penalizing its mean test accuracy.

  7. Knowl 7 — Parameter-Constrained Grid Search for GNN Hyperparameter Optimization

    experimental setup

    To ensure fair comparison across architectures, a grid search is performed over the following hyperparameter search space:

    • Hidden size: {8,16,32,64}\{8, 16, 32, 64\}
    • Learning rate: {0.001,0.003,0.005,0.008,0.01}\{0.001, 0.003, 0.005, 0.008, 0.01\}
    • Dropout probability: {0.2,0.3,0.4,0.5,0.6,0.7,0.8}\{0.2, 0.3, 0.4, 0.5, 0.6, 0.7, 0.8\}
    • Attention coefficient dropout (GAT only): {0.2,0.3,0.4,0.5,0.6,0.7,0.8}\{0.2, 0.3, 0.4, 0.5, 0.6, 0.7, 0.8\}
    • L2L_2 regularization strength: {1e-4,5e-4,1e-3,5e-3,1e-2,5e-2,1e-1}\{1\text{e-}4, 5\text{e-}4, 1\text{e-}3, 5\text{e-}3, 1\text{e-}2, 5\text{e-}2, 1\text{e-}1\}

    The search space is constrained such that every model has at most the same budget of trainable parameters (approximately 92K92\text{K}--94K94\text{K} weights). The optimal configuration for each model is selected by maximizing average accuracy on the CORA and CiteSeer datasets across 100 splits and 20 initializations:

    Model Effective hidden size Learning rate Dropout L2L_2 reg. strength Trainable weights
    GCN 64 0.01 0.8 0.001 92K
    GAT 64 0.01 0.6 / 0.3 0.01 92K
    MoNet 64 0.003 0.7 0.05 92K
    GS-mean 32 0.001 0.4 0.1 92K
    GS-maxpool 32 / 32 0.001 0.3 0.005 94K
    GS-meanpool 32 / 8 0.001 0.2 0.01 58K
    MLP 64 0.005 0.8 0.01 92K
    LogReg – 0.1 – 0.0005 10K

    Notes: GAT uses 8 attention heads, MoNet uses 2 Gaussian kernels, and GraphSAGE includes skip-connection weights.

  8. Knowl 8 — Discrepancies in Published GNN Training Procedures

    empirical result

    Original published implementations of prominent GNN models employ drastically disparate training setups, obscuring whether reported improvements stem from architecture or optimization differences:

    • GCN (Kipf and Welling, 2017): Full-batch training; maximum 200 epochs; early stopping triggers when the validation loss exceeds the mean validation loss of the preceding 10 epochs.
    • MoNet (Monti et al., 2017): Full-batch training; maximum 3,000 epochs (CORA) or 1,000 epochs (PubMed); no early stopping; alternating optimization between Gaussian kernel parameters and weight matrices; predefined learning rate decay schedule on CORA.
    • GAT (Veličković et al., 2018): Full-batch training; maximum 100,000 epochs; early stopping triggers when neither validation loss nor validation accuracy improves for 100 consecutive epochs.
    • GraphSAGE (Hamilton et al., 2017): Mini-batch training (batch size 512); maximum 10 epochs (each epoch containing multiple mini-batches); no early stopping.

Coverage note — None was omitted; all major empirical results, tables, methodological frameworks, hyperparameter details, and dataset statistics have been included.

References

  1. 1.A. Bojchevski and S. Günnemann. Deep gaussian embedding of attributed graphs: Unsupervised inductive learning via ranking. ICLR, 2018.
  2. 2.O. Chapelle, B. Scholkopf, and A. Zien. Semi-supervised learning. 2009.
  3. 3.J. Friedman, T. Hastie, and R. Tibshirani. The elements of statistical learning. 2001.
  4. 4.X. Glorot and Y. Bengio. Understanding the difficulty of training deep feedforward neural networks. In AISTATS, 2010.
  5. 5.W. L. Hamilton, R. Ying, and J. Leskovec. Inductive representation learning on large graphs. NIPS, 2017.
  6. 6.D. P. Kingma and J. Ba. Adam: A method for stochastic optimization. ICLR, 2015.
  7. 7.T. N. Kipf and M. Welling. Semi-supervised classification with graph convolutional networks. ICLR, 2017.
  8. 8.J. Klicpera, A. Bojchevski, and S. Günnemann. Predict then propagate: Graph neural networks meet personalized PageRank. ICLR, 2019.
  9. 9.Z. C. Lipton and J. Steinhardt. Troubling trends in machine learning scholarship. arXiv preprint arXiv:1807.03341, 2018.
  10. 10.M. Lucic, K. Kurach, M. Michalski, S. Gelly, and O. Bousquet. Are GANs created equal? A large-scale study. arXiv preprint arXiv:1711.10337, 2017.
  11. 11.J. McAuley, C. Targett, Q. Shi, and A. Van Den Hengel. Image-based recommendations on styles and substitutes. In SIGIR, 2015.
  12. 12.G. Melis, C. Dyer, and P. Blunsom. On the state of the art of evaluation in neural language models. ICLR, 2018.
  13. 13.F. Monti, D. Boscaini, J. Masci, E. Rodolà, J. Svoboda, and M. M. Bronstein. Geometric deep learning on graphs and manifolds using mixture model CNNs. CVPR, 2017.
  14. 14.G. Namata, B. London, L. Getoor, and B. Huang. Query-driven active surveying for collective classification. 2012.
  15. 15.P. Sen, G. Namata, M. Bilgic, L. Getoor, B. Galligher, and T. Eliassi-Rad. Collective classification in network data. AI magazine, 29, 2008.
  16. 16.P. Velickovic, G. Cucurull, A. Casanova, A. Romero, P. Liò, and Y. Bengio. Graph attention networks. ICLR, 2018.
  17. 17.Z. Yang, W. W. Cohen, and R. Salakhutdinov. Revisiting semi-supervised learning with graph embeddings. ICML, 2016.
  18. 18.D. Zügner, A. Akbarnejad, and S. Günnemann. Adversarial attacks on neural networks for graph data. In KDD, 2018.

Citation

MLA
Shchur, O., et al. “Pitfalls of Graph Neural Network Evaluation”. arXiv, 2018, http://arxiv.org/abs/1811.05868v2.
APA
Shchur, O., Mumme, M., Bojchevski, A., & Günnemann, S. (2018). Pitfalls of Graph Neural Network Evaluation. arXiv. http://arxiv.org/abs/1811.05868v2
Chicago
Shchur, O., M. Mumme, A. Bojchevski, and S. Günnemann. 2018. “Pitfalls of Graph Neural Network Evaluation”. arXiv. http://arxiv.org/abs/1811.05868v2.
Harvard
Shchur, O. et al. (2018) “Pitfalls of Graph Neural Network Evaluation”, arXiv [Preprint]. Available at: http://arxiv.org/abs/1811.05868v2.
Vancouver
1. Shchur O, Mumme M, Bojchevski A, Günnemann S (2018) Pitfalls of Graph Neural Network Evaluation. arXiv

BibTeX

@article{shchur2018pitfalls,
  title = {Pitfalls of Graph Neural Network Evaluation},
  author = {Shchur, Oleksandr and Mumme, Maximilian and Bojchevski, Aleksandar and Günnemann, Stephan},
  year = {2018},
  journal = {arXiv},
  url = {http://arxiv.org/abs/1811.05868v2},
  eprint = {1811.05868}
}
Metadata:arXiv

Source Code

This paper has an official code repository available. Click below to access the source code.

View Repository

Access the Paper

This paper is available from its original source. Click below to access the PDF.

Open PDF

License: Authors