Fingerprint Image Enhancement: Algorithm and Performance Evaluation

Lin HongYifei WanAnil K. Jain

article1998TPAMI2,440 citations

Presents an adaptive ridge-frequency and orientation enhancement method that measurably improves fingerprint minutiae quality and verification accuracy.

Listen

Automatic fingerprint verification systems rely heavily on accurately identifying key ridge features, such as ridge endings and bifurcations, known as minutiae. In practical deployments, approximately 10 percent of captured fingerprint images exhibit poor quality due to skin variations, occupational marks, improper contact, and sensor noise. Poor-quality scans introduce false minutiae, omit genuine ones, and cause severe localization errors, ultimately undermining system accuracy and security.

The article evaluates a fast, adaptive fingerprint enhancement algorithm designed to restore ridge and valley structures in degraded images without altering the biometric individuality of the fingerprint. The primary objective is to demonstrate that incorporating this enhancement step directly improves minutiae extraction quality and overall verification accuracy in real-time automated systems.

The proposed method processes grayscale images through five distinct stages: intensity normalization, local ridge orientation estimation using a computationally efficient least-squares method, local ridge frequency estimation, region classification, and adaptive filtering. The region classification step segregates the image into recoverable areas and severely corrupted unrecoverable areas, rejecting images where recoverable regions fall below 40 percent. Recoverable areas are then filtered using a bank of Gabor filters tuned to local ridge orientations and frequencies. The authors evaluated the approach using 50 poor-quality images from IBM to measure a minutiae "Goodness Index" (which penalizes missing and spurious minutiae) and tested verification performance on the Michigan State University database containing 700 live-scan images from 70 individuals.

The findings confirm that the enhancement algorithm substantially improves system performance. First, applying the enhancement to poor-quality images increased the mean Goodness Index from 0.24 to 0.39, representing an improvement of approximately 60 percent. Second, system verification tests demonstrated a significant reduction in the false reject rate while maintaining the target false accept rate. Third, the total enhancement processing time was recorded at approximately 2.49 seconds per image on a standard 200 MHz personal computer, confirming its feasibility for real-time, online applications.

These results indicate that automated biometric systems can achieve higher operational reliability and user throughput by filtering noise prior to feature extraction. In practice, reducing the false reject rate lowers operational friction and administrative overhead caused by re-scans or manual identity verification, while the removal of unrecoverable regions prevents fraudulent matches from corrupted data. The article's findings challenge the prior assumption that adaptive frequency and orientation filtering is too computationally intensive for real-time systems.

Organizations developing or deploying biometric access control should integrate adaptive Gabor filtering into their feature extraction pipelines and implement strict quality thresholds to reject heavily corrupted scans automatically. For future development, the authors suggest exploring global ridge models to correct local orientation errors and incorporating global features to enhance region classification accuracy.

Readers should note that the performance evaluations were conducted on moderate sample sizes (50 degraded images for minutiae quality and 700 images across 70 individuals for verification) using hardware configurations standard at the time of the study. While confidence in the algorithmic mechanism and relative performance gains is high, operational performance on modern high-throughput hardware and diverse sensor types should be validated through scaled pilot testing.

  • Paper: Statistical Pattern Recognition: A Review, Anil K. Jain et al. (2000). Read this review after the source to see how fingerprint image enhancement fits into the broader landscape of statistical pattern recognition and feature extraction.
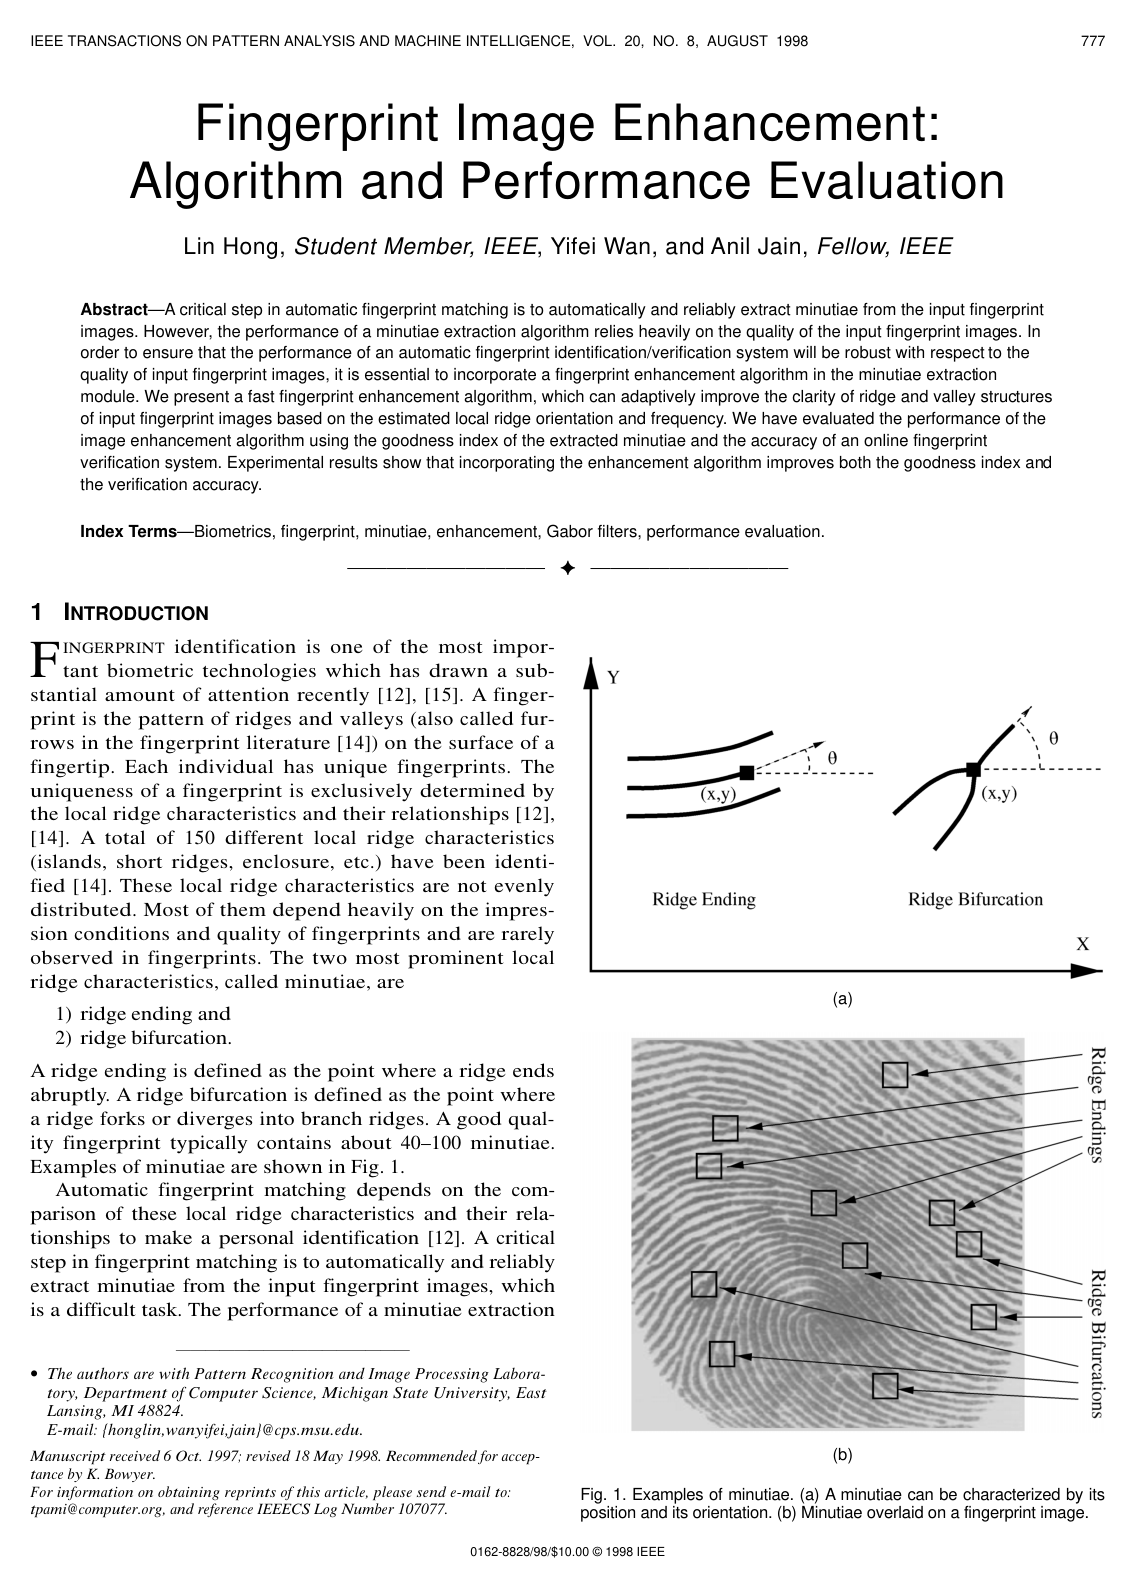
Cover for Fingerprint Image Enhancement: Algorithm and Performance Evaluation

Abstract

A critical step in automatic fingerprint matching is to automatically and reliably extract minutiae from the input fingerprint images. However, the performance of a minutiae extraction algorithm relies heavily on the quality of the input fingerprint images. In order to ensure that the performance of an automatic fingerprint identification/verification system will be robust with respect to the quality of input fingerprint images, it is essential to incorporate a fingerprint enhancement algorithm in the minutiae extraction module. We present a fast fingerprint enhancement algorithm, which can adaptively improve the clarity of ridge and valley structures of input fingerprint images based on the estimated local ridge orientation and frequency. We have evaluated the performance of the image enhancement algorithm using the goodness index of the extracted minutiae and the accuracy of an online fingerprint verification system. Experimental results show that incorporating the enhancement algorithm improves both the goodness index and the verification accuracy.

Table of Contents

  • 1 INTRODUCTION
  • 2 FINGERPRINT ENHANCEMENT
  • 2.1 Notation
  • 2.2 Algorithm
  • 2.3 Normalization
  • 2.4 Orientation Image
  • 2.5 Ridge Frequency Image
  • 2.6 Region Mask
  • 2.7 Filtering
  • 3 EXPERIMENTAL RESULTS
  • 3.1 Evaluation Using Goodness Index
  • 3.2 Evaluation Using Verification Performance
  • 4 SUMMARY AND CONCLUSIONS
  • ACKNOWLEDGMENTS
  • REFERENCES

Knowls

  1. Knowl 1 — Adaptive Gabor-Based Fingerprint Image Enhancement Pipeline

    algorithm

    Fingerprint enhancement adaptively reconstructs corrupted ridge and valley structures in recoverable fingerprint regions while discarding unrecoverable noise regions prior to minutiae extraction. The algorithm operates on an input gray-level fingerprint image II of size N×NN \times N (scanned at 500 dpi resolution) through five sequential stages: image normalization, least mean square local orientation estimation, oriented-window local frequency estimation, block-wise region mask classification, and directional 2D Gabor filtering.

    Input: Gray-level fingerprint image II of dimension N×NN \times N, target mean M0=100M_0 = 100, target variance VAR0=100\mathrm{VAR}_0 = 100, block size w=16w = 16, orientation filter size wΦ=5w_\Phi = 5, oriented window dimensions l=32l = 32 and w=16w = 16, frequency kernel size wΩ=7w_\Omega = 7, frequency filter size wl=7w_l = 7, Gabor filter size wg=11w_g = 11, Gabor standard deviations δx=4.0\delta_x = 4.0 and δy=4.0\delta_y = 4.0, threshold Γrecoverable=40%\Gamma_{\mathrm{recoverable}} = 40\%
    Output: Enhanced fingerprint image EE (or rejection of II if image quality is insufficient)
    1. Compute global sample mean MM and sample variance VAR\mathrm{VAR} of II
    2. Normalize image II pixel-wise to obtain normalized image GG with mean M0M_0 and variance VAR0\mathrm{VAR}_0
    3. Divide GG into nonoverlapping blocks of size w×ww \times w
    4. Compute spatial gradient vectors (x,y)(\partial_x, \partial_y) across GG
    5. Compute raw block orientations θ(i,j)\theta(i,j) using least mean square gradient estimation
    6. Convert θ(i,j)\theta(i,j) into continuous vector field (Φx,Φy)=(cos(2θ),sin(2θ))(\Phi_x, \Phi_y) = (\cos(2\theta), \sin(2\theta))
    7. Smooth the vector field using a 2D low-pass filter WW of size wΦ×wΦw_\Phi \times w_\Phi to obtain smoothed orientation image O(i,j)O(i,j)
    8. For each block (i,j)(i, j):
        a. Project pixel intensities in an oriented window of size l×wl \times w along the ridge direction to compute xx-signature X[0l1]X[0 \dots l-1]
        b. Estimate peak-to-peak distance T(i,j)T(i,j) and initial local frequency Ω(i,j)=1/T(i,j)\Omega(i,j) = 1/T(i,j)
        c. Extract three wave features: amplitude α\alpha, frequency β\beta, and variance γ\gamma from XX
        d. Classify block (i,j)(i, j) as recoverable (R(i,j)=1R(i,j)=1) or unrecoverable (R(i,j)=0R(i,j)=0) using 1-NN against 6 pre-trained cluster centers
    9. If (number of blocks with R(i,j)=1R(i,j)=1) / total blocks <Γrecoverable< \Gamma_{\mathrm{recoverable}}:
        return REJECT_IMAGE
    10. Interpolate invalid local frequencies (Ω(i,j)=1)(\Omega(i,j) = -1) iteratively using Gaussian kernel WgW_g of size wΩ×wΩw_\Omega \times w_\Omega
    11. Smooth the resulting frequency field with 2D low-pass filter WlW_l of size wl×wlw_l \times w_l to obtain frequency image F(i,j)\mathcal{F}(i,j)
    12. For each pixel (i,j)(i,j) in GG:
        if R(i,j)==1R(i,j) == 1:
            E(i,j)=u=wg/2wg/2v=wg/2wg/2h(u,v;O(i,j),F(i,j))G(iu,jv)E(i,j) = \sum_{u=-w_g/2}^{w_g/2} \sum_{v=-w_g/2}^{w_g/2} h(u, v; O(i,j), \mathcal{F}(i,j)) \cdot G(i-u, j-v)
        else:
            E(i,j)=255E(i,j) = 255
    13. return Enhanced image EE
  2. Knowl 2 — Pixel-Wise Fingerprint Image Normalization

    model/method

    Image normalization standardizes the dynamic range of gray-level intensities across a fingerprint image to reduce variations along ridge and valley trajectories without altering the underlying geometric ridge-valley clarity. Given an N×NN \times N gray-level fingerprint image II, where I(i,j)I(i, j) is the intensity at row ii and column jj, the global image mean MM and variance VAR\mathrm{VAR} are defined as:

    M=1N2i=0N1j=0N1I(i,j)M = \frac{1}{N^2} \sum_{i=0}^{N-1} \sum_{j=0}^{N-1} I(i, j)

    VAR=1N2i=0N1j=0N1(I(i,j)M)2\mathrm{VAR} = \frac{1}{N^2} \sum_{i=0}^{N-1} \sum_{j=0}^{N-1} (I(i, j) - M)^2

    The normalized intensity G(i,j)G(i, j) at pixel (i,j)(i, j) is computed via the piecewise nonlinear transformation:

    G(i,j)={M0+VAR0(I(i,j)M)2VAR,if I(i,j)>MM0VAR0(I(i,j)M)2VAR,otherwiseG(i, j) = \begin{cases} M_0 + \sqrt{\frac{\mathrm{VAR}_0 (I(i, j) - M)^2}{\mathrm{VAR}}}, & \text{if } I(i, j) > M \\ M_0 - \sqrt{\frac{\mathrm{VAR}_0 (I(i, j) - M)^2}{\mathrm{VAR}}}, & \text{otherwise} \end{cases}

    where M0M_0 and VAR0\mathrm{VAR}_0 denote the target mean and variance, respectively (chosen as M0=100M_0 = 100 and VAR0=100\mathrm{VAR}_0 = 100 for 500 dpi fingerprint images).

  3. Knowl 3 — Least Mean Square Local Ridge Orientation Estimation and Vector Smoothing

    algorithm

    The local ridge orientation represents the direction orthogonal to the dominant Fourier spectrum in a local neighborhood. To prevent orientation estimation errors caused by noise, creases, and minutiae, orientation estimation is computed block-wise using gradient summation followed by continuous 2D vector field low-pass filtering.

    Input: Normalized fingerprint image GG of size N×NN \times N, block size w=16w = 16, smoothing filter size wΦ=5w_\Phi = 5
    Output: Smoothed orientation image OO where O(i,j)[0,π)O(i, j) \in [0, \pi)
    1. Divide image GG into nonoverlapping blocks of size w×ww \times w (centered at (i,j)(i, j))
    2. Compute spatial gradients x(u,v)\partial_x(u, v) and y(u,v)\partial_y(u, v) at each pixel (u,v)(u, v) using a Sobel or Marr-Hildreth gradient operator
    3. For each block centered at (i,j)(i, j), compute gradient covariance sums:
        Vx(i,j)=u=iw/2i+w/2v=jw/2j+w/22x(u,v)y(u,v)V_x(i, j) = \sum_{u=i-w/2}^{i+w/2} \sum_{v=j-w/2}^{j+w/2} 2 \partial_x(u, v) \partial_y(u, v)
        Vy(i,j)=u=iw/2i+w/2v=jw/2j+w/2(x2(u,v)y2(u,v))V_y(i, j) = \sum_{u=i-w/2}^{i+w/2} \sum_{v=j-w/2}^{j+w/2} (\partial_x^2(u, v) - \partial_y^2(u, v))
    4. Compute the least square orientation estimate:
        $\theta(i, j) = \frac{1}{2} \arctan\left(\frac{V_y(i, j)}{V_x(i, j)}
    ight)$
    5. Convert the cyclic orientation θ(i,j)\theta(i, j) into a continuous vector field (Φx(i,j),Φy(i,j))(\Phi_x(i, j), \Phi_y(i, j)):
        Φx(i,j)=cos(2θ(i,j))\Phi_x(i, j) = \cos(2\theta(i, j))
        Φy(i,j)=sin(2θ(i,j))\Phi_y(i, j) = \sin(2\theta(i, j))
    6. Apply 2D low-pass filter WW (with unit integral, dimension wΦ×wΦ=5×5w_\Phi \times w_\Phi = 5 \times 5) at block level:
        Φx(i,j)=u=wΦ/2wΦ/2v=wΦ/2wΦ/2W(u,v)Φx(iuw,jvw)\Phi'_x(i, j) = \sum_{u=-w_\Phi/2}^{w_\Phi/2} \sum_{v=-w_\Phi/2}^{w_\Phi/2} W(u, v) \Phi_x(i - u w, j - v w)
        Φy(i,j)=u=wΦ/2wΦ/2v=wΦ/2wΦ/2W(u,v)Φy(iuw,jvw)\Phi'_y(i, j) = \sum_{u=-w_\Phi/2}^{w_\Phi/2} \sum_{v=-w_\Phi/2}^{w_\Phi/2} W(u, v) \Phi_y(i - u w, j - v w)
    7. Compute final smoothed block orientation:
        $O(i, j) = \frac{1}{2} \arctan\left(\frac{\Phi'_y(i, j)}{\Phi'_x(i, j)}
    ight)$
    8. return Orientation image OO
  4. Knowl 4 — Local Ridge Frequency Estimation via X-Signature Analysis and Iterative Gaussian Interpolation

    algorithm

    In fingerprint regions free of singular points and minutiae, ridge and valley gray levels form a sinusoidal wave along a direction orthogonal to the local ridge orientation. The local ridge frequency F(i,j)\mathcal{F}(i, j) is estimated from the 1D projection (x-signature) within an oriented window, validated against physical constraints, and interpolated across corrupted blocks.

    Input: Normalized image GG, orientation image OO, block size w=16w = 16, window length l=32l = 32, kernel size wΩ=7w_\Omega = 7, filter size wl=7w_l = 7, valid range [1/25,1/3][1/25, 1/3]
    Output: Smoothed frequency image F\mathcal{F}
    1. For each block (i,j)(i, j) of size w×ww \times w, form an oriented rectangular window of size l×wl \times w aligned along local ridge orientation O(i,j)O(i, j)
    2. Compute the x-signature X[k]X[k] for k=0,1,,l1k = 0, 1, \dots, l-1:
        X[k]=1wd=0w1G(u,v)X[k] = \frac{1}{w} \sum_{d=0}^{w-1} G(u, v)
        where coordinates (u,v)(u, v) are given by:
        u=i+(dw2)cosO(i,j)+(kl2)sinO(i,j)u = i + (d - \frac{w}{2}) \cos O(i, j) + (k - \frac{l}{2}) \sin O(i, j)
        v=j+(dw2)sinO(i,j)+(l2k)cosO(i,j)v = j + (d - \frac{w}{2}) \sin O(i, j) + (\frac{l}{2} - k) \cos O(i, j)
    3. Find consecutive local peaks in X[k]X[k]. Let T(i,j)T(i, j) be the average inter-peak distance in pixels.
    4. If peaks cannot be detected or if 1/T(i,j)[1/25,1/3]1/T(i, j) \notin [1/25, 1/3]:
        Set initial frequency Ω(i,j)=1\Omega(i, j) = -1
       else:
        Set initial frequency Ω(i,j)=1/T(i,j)\Omega(i, j) = 1/T(i, j)
    5. While there exists at least one block with Ω(i,j)==1\Omega(i, j) == -1:
        For each block (i,j)(i, j):
            if Ω(i,j)1\Omega(i, j) \neq -1:
                Ω(i,j)=Ω(i,j)\Omega'(i, j) = \Omega(i, j)
            else:
                Ω(i,j)=u=wΩ/2wΩ/2v=wΩ/2wΩ/2Wg(u,v)μ(Ω(iuw,jvw))u=wΩ/2wΩ/2v=wΩ/2wΩ/2Wg(u,v)δ(Ω(iuw,jvw)+1)\Omega'(i, j) = \frac{\sum_{u=-w_\Omega/2}^{w_\Omega/2} \sum_{v=-w_\Omega/2}^{w_\Omega/2} W_g(u, v) \mu(\Omega(i - uw, j - vw))}{\sum_{u=-w_\Omega/2}^{w_\Omega/2} \sum_{v=-w_\Omega/2}^{w_\Omega/2} W_g(u, v) \delta(\Omega(i - uw, j - vw) + 1)}
                where WgW_g is a 2D Gaussian kernel of size wΩ×wΩ=7×7w_\Omega \times w_\Omega = 7 \times 7 (mean 0, variance 9), μ(x)=x\mu(x) = x if x>0x > 0 else 00, and δ(x)=1\delta(x) = 1 if x>0x > 0 else 00
        Swap Ω\Omega and Ω\Omega'
    6. Apply 2D low-pass filter WlW_l of size wl×wl=7×7w_l \times w_l = 7 \times 7 (with unit integral) to smooth the frequency image:
        F(i,j)=u=wl/2wl/2v=wl/2wl/2Wl(u,v)Ω(iuw,jvw)\mathcal{F}(i, j) = \sum_{u=-w_l/2}^{w_l/2} \sum_{v=-w_l/2}^{w_l/2} W_l(u, v) \Omega'(i - uw, j - vw)
    7. return Smoothed frequency image F\mathcal{F}
  5. Knowl 5 — Region Mask Segmentation via Sinusoidal Wave Features and 1-NN Classification

    model/method

    Fingerprint images are segmented into recoverable regions (R(i,j)=1R(i, j) = 1) and unrecoverable corrupted regions (R(i,j)=0R(i, j) = 0) by assessing the local sinusoidal profile of ridges and valleys. For each block of size w×ww \times w (16×1616 \times 16) centered at (i,j)(i, j), an oriented xx-signature X[1l]X[1 \dots l] of length l=32l = 32 is extracted, and three features are computed:

    1. Amplitude (α\alpha): α=average height of peaksaverage depth of valleys\alpha = \text{average height of peaks} - \text{average depth of valleys}
    2. Frequency (β\beta): β=1/T(i,j)\beta = 1/T(i, j), where T(i,j)T(i, j) is the average pixel distance between consecutive peaks
    3. Variance (γ\gamma):

    γ=1lk=1l(X[k]1lm=1lX[m])2\gamma = \frac{1}{l} \sum_{k=1}^l \left( X[k] - \frac{1}{l} \sum_{m=1}^l X[m] \right)^2

    A 1-Nearest Neighbor (1-NN) classifier evaluates the feature vector (α,β,γ)(\alpha, \beta, \gamma) against six cluster prototype centers obtained via squared-error clustering on 2,000 manually labeled training patterns. Four prototypes represent recoverable regions, and two represent unrecoverable regions. If the proportion of recoverable blocks across the image is below Γrecoverable=40%\Gamma_{\mathrm{recoverable}} = 40\%, the image is deemed corrupted beyond recovery and rejected.

  6. Knowl 6 — Directional Even-Symmetric 2D Gabor Filtering for Fingerprint Enhancement

    model/method

    Even-symmetric 2D Gabor filters act as bandpass filters with optimal joint localization in spatial and frequency domains, tuned to local ridge orientation and frequency to attenuate noise while preserving true ridges.

    The spatial impulse response of the even-symmetric Gabor filter is:

    h(x,y;ϕ,f)=exp(12[xϕ2δx2+yϕ2δy2])cos(2πfxϕ)h(x, y; \phi, f) = \exp\left( -\frac{1}{2} \left[ \frac{x_\phi^2}{\delta_x^2} + \frac{y_\phi^2}{\delta_y^2} \right] \right) \cos(2\pi f x_\phi)

    where the rotated spatial coordinates (xϕ,yϕ)(x_\phi, y_\phi) are defined by:

    xϕ=xcosϕ+ysinϕx_\phi = x \cos \phi + y \sin \phi

    yϕ=xsinϕ+ycosϕy_\phi = -x \sin \phi + y \cos \phi

    Here, ϕ\phi is the filter orientation (set to local orientation O(i,j)O(i, j)), ff is the filter center frequency (set to local frequency F(i,j)\mathcal{F}(i, j)), and δx,δy\delta_x, \delta_y are the Gaussian envelope space constants along the xx- and yy-axes, respectively. An empirical trade-off between noise robustness and avoiding spurious ridge generation sets δx=4.0\delta_x = 4.0 and δy=4.0\delta_y = 4.0 with a filter mask size of wg×wg=11×11w_g \times w_g = 11 \times 11.

    The enhanced image E(i,j)E(i, j) is generated by convolving the normalized image GG with the local Gabor filter only on recoverable blocks (R(i,j)=1R(i, j) = 1):

    E(i,j)={u=wg/2wg/2v=wg/2wg/2h(u,v;O(i,j),F(i,j))G(iu,jv),if R(i,j)=1255,if R(i,j)=0E(i, j) = \begin{cases} \sum_{u=-w_g/2}^{w_g/2} \sum_{v=-w_g/2}^{w_g/2} h(u, v; O(i, j), \mathcal{F}(i, j)) G(i - u, j - v), & \text{if } R(i, j) = 1 \\ 255, & \text{if } R(i, j) = 0 \end{cases}

  7. Knowl 7 — Minutiae Goodness Index (GI) Metric

    definition

    The Goodness Index (GIGI) quantitatively evaluates the quality of minutiae detected by an automated algorithm relative to ground-truth minutiae marked by a human expert. For an image partitioned into rr nonoverlapping windows of size 16×1616 \times 16, GIGI is defined as:

    GI=i=1rqi(piaibi)i=1rqitiGI = \frac{\sum_{i=1}^r q_i (p_i - a_i - b_i)}{\sum_{i=1}^r q_i t_i}

    where:

    • rr is the total number of 16×1616 \times 16 windows in the fingerprint image.
    • qiq_i is the empirical quality factor assigned to the iith window (qi=4q_i = 4 for good quality, qi=2q_i = 2 for medium quality, and qi=1q_i = 1 for poor quality).
    • pip_i is the number of successfully paired minutiae in the iith window, where a detected minutia and an expert ground-truth minutia are paired if the detected minutia falls within an 8×88 \times 8 pixel tolerance box centered at the expert minutia.
    • aia_i is the number of missing minutiae (ground-truth minutiae not detected) in the iith window.
    • bib_i is the number of spurious minutiae (detected minutiae not matching any ground truth) in the iith window.
    • tit_i is the total number of ground-truth minutiae in the iith window.

    GIGI has a maximum theoretical value of 11 (achieved when there are no missing and no spurious minutiae, i.e., ai=bi=0a_i = b_i = 0 and pi=tip_i = t_i for all ii).

  8. Knowl 8 — Quantitative Minutiae Extraction Quality Improvement via Goodness Index

    data/table

    The effect of the Gabor-based enhancement algorithm on minutiae extraction was evaluated across 50 poor-quality fingerprint images obtained from IBM. Minutiae extraction was performed directly on raw images versus images enhanced by the proposed algorithm, using human-expert minutiae ground truth and an 8×88 \times 8 pixel pairing tolerance box.

    Image # Without Enhancement With Enhancement
    1 0.46 0.55
    2 0.38 0.52
    3 0.29 0.42
    4 0.26 0.39
    5 0.21 0.35
    6 0.12 0.31
    7 0.11 0.26
    8 0.10 0.29
    Mean 0.24 0.39
    Std 0.05 0.04

    Across all 50 test images, the Goodness Index increased consistently after enhancement, raising the mean GI from 0.240.24 (standard deviation 0.050.05) to 0.390.39 (standard deviation 0.040.04). This demonstrates a significant reduction in spurious and missed minutiae detections.

  9. Knowl 9 — Verification Performance and ROC Improvement on Live-Scan Fingerprint Database

    empirical result

    The enhancement algorithm was integrated into an online fingerprint verification system and tested on Volume 1 of the MSU fingerprint database (comprising 700 live-scan fingerprint images from 70 individuals, with 10 impressions per individual). Matching accuracy was compared with and without enhancement across all cross-matching combinations.

    Receiver Operating Characteristic (ROC) curves showed that incorporating Gabor-based enhancement substantially shifted the performance curve, markedly reducing the False Reject Rate (FRR) across the entire range of False Accept Rates (FAR). For instance, at FAR=102%\mathrm{FAR} = 10^{-2}\%, the Authentic Acceptance Rate increased from approximately 72%72\% without enhancement to approximately 88%88\% with enhancement, and at FAR=101%\mathrm{FAR} = 10^{-1}\%, it increased from approximately 82%82\% to approximately 95%95\%.

  10. Knowl 10 — Execution Time Breakdown of Fingerprint Enhancement Stages

    data/table

    The computational execution time (wall-clock time) for each stage of the enhancement algorithm was benchmarked on a Pentium 200 MHz PC to assess suitability for real-time online verification systems.

    Normalization Orientation Frequency Region Mask Filtering Total
    (seconds) (seconds) (seconds) (seconds) (seconds) (seconds)
    0.11 0.14 0.09 0.07 2.08 2.49

    The total enhancement time is 2.492.49 seconds per image, with directional Gabor filtering accounting for the largest share (2.082.08 seconds or 83.5%\approx 83.5\% of total time), confirming the algorithm's operational feasibility for online biometric systems.

Coverage note — Omitted prior external minutiae matching algorithms, background surveys of legacy binarization heuristics, and the multi-filter orientation bank decomposition method from earlier literature referenced for context.

References

  1. 1.T. Chang, “Texture Analysis of Digitized Fingerprints for Singularity Detection,” Proc. Fifth ICPR, pp. 478-480, 1980.
  2. 2.P.E. Danielsson and Q. Z. Ye, “Rotation-Invariant Operators Applied to Enhancement of Fingerprints,” Proc. Ninth ICPR, pp. 329-333, Rome, 1988.
  3. 3.J.G. Daugman, “Uncertainty Relation for Resolution in Space, Spatial-Frequency, and Orientation Optimized by Two-Dimensional Visual Cortical Filters,” J. Optical Soc. Am., vol. 2, pp. 1,160-1,169, 1985.
  4. 4.L. Hong, A.K. Jain, S. Pankanti, and R. Bolle, “Fingerprint Enhancement,” Proc. First IEEE WACV, pp. 202-207, Sarasota, Fla., 1996.
  5. 5.D.C. Huang, “Enhancement and Feature Purification of Fingerprint Images,” Pattern Recognition, vol. 26, no. 11, pp. 1,661-1,671, 1993.
  6. 6.A. Jain, L. Hong, and R. Bolle, “On-Line Fingerprint Verification,” IEEE Trans. Pattern Analysis and Machine Intelligence, vol. 19, no. 4, pp. 302-314, 1997.
  7. 7.A.K. Jain and F. Farrokhnia, “Unsupervised Texture Segmentation Using Gabor Filters,” Pattern Recognition, vol. 24, no. 12, pp. 1,167-1,186, 1991.
  8. 8.T. Kamei and M. Mizoguchi, “Image Filter Design for Fingerprint Enhancement,” Proc. ISCV’ 95, pp. 109-114, Coral Gables, Fla., 1995.
  9. 9.K. Karu and A.K. Jain, “Fingerprint Classification,” Pattern Recognition, vol. 29no. 3, pp. 389-404, 1996.
  10. 10.M. Kass and A. Witkin, “Analyzing Oriented Patterns,” Computer Vision, Graphics, and Image Processing, vol. 37, no. 4, pp. 362-385, 1987.
  11. 11.M. Kawagoe and A. Tojo, “Fingerprint Pattern Classification,” Pattern Recognition, vol. 17, no. 3, pp. 295-303, 1984.
  12. 12.H.C. Lee and R.E. Gaensslen, Advances in Fingerprint Technology. New York, NY: Elsevier, 1991.
  13. 13.D. Marr, Vision. San Francisco, Calif.: W.H. Freeman, 1982.
  14. 14.A. Moenssens, Fingerprint Techniques. London: Chilton Book Company, 1971.
  15. 15.E. Newham, The Biometric Report. New York, NY: SJB Services, 1995.
  16. 16.L. O’Gorman and J.V. Nickerson, “An Approach to Fingerprint Filter Design,” Pattern Recognition, vol. 22, no. 1, pp. 29-38, 1989.
  17. 17.A. Rao, A Taxonomy for Texture Description and Identification. New York, NY: Springer-Verlag, 1990.
  18. 18.N. Ratha, S. Chen, and A.K. Jain, “Adaptive Flow Orientation Based Feature Extraction in Fingerprint Images,” Pattern Recognition, vol. 28, no. 11, pp. 1,657-1,672, 1995.
  19. 19.G. Sapiro and A. Bruckstein, “A B-Spline Based Affine Invariant Multiscale Shape Representation,” Proc. Seventh Int’l Conf. Image Analysis and Processing III, pp. 20-22, Monopoli, Italy, 1993.
  20. 20.D. Sherlock, D.M. Monro, and K. Millard, “Fingerprint Enhancement by Directional Fourier Filtering,” IEE Proc. Visual Image Signal Processing, vol. 141, no. 2, pp. 87–94, 1994.
  21. 21.A. Sherstinsky and R.W. Picard, “Restoration and Enhancement of Fingerprint Images Using M-Lattice: A Novel Non-Linear Dynamical System,” Proc. 12th ICPR-B, pp. 195–200, 1994.
  22. 22.O. Trier and A. Jain, “Goal-Directed Evaluation of Binarization Methods,” IEEE Trans. Pattern Analysis and Machine Intelligence, vol. 17, no. 12, pp. 1,191–1,201, 1996.

Citation

MLA
Lin Hong, et al. “Fingerprint Image Enhancement: Algorithm and Performance Evaluation”. IEEE Transactions on Pattern Analysis and Machine Intelligence, vol. 20, no. 8, 1998, pp. 777–89, https://doi.org/10.1109/34.709565.
APA
Lin Hong, Yifei Wan, & Jain, A. (1998). Fingerprint image enhancement: algorithm and performance evaluation. IEEE Transactions on Pattern Analysis and Machine Intelligence, 20(8), 777–789. https://doi.org/10.1109/34.709565
Chicago
Lin Hong, Yifei Wan, and A. Jain. 1998. “Fingerprint Image Enhancement: Algorithm and Performance Evaluation”. IEEE Transactions on Pattern Analysis and Machine Intelligence 20 (8): 777–89. https://doi.org/10.1109/34.709565.
Harvard
Lin Hong, Yifei Wan and Jain, A. (1998) “Fingerprint image enhancement: algorithm and performance evaluation”, IEEE Transactions on Pattern Analysis and Machine Intelligence, 20(8), pp. 777–789. Available at: https://doi.org/10.1109/34.709565.
Vancouver
1. Lin Hong, Yifei Wan, Jain A (1998) Fingerprint image enhancement: algorithm and performance evaluation. IEEE Transactions on Pattern Analysis and Machine Intelligence 20:777–789

BibTeX

@article{Lin_Hong_1998, title={Fingerprint image enhancement: algorithm and performance evaluation}, volume={20}, ISSN={0162-8828}, url={http://dx.doi.org/10.1109/34.709565}, DOI={10.1109/34.709565}, number={8}, journal={IEEE Transactions on Pattern Analysis and Machine Intelligence}, publisher={Institute of Electrical and Electronics Engineers (IEEE)}, author={Lin Hong and Yifei Wan and Jain, A.}, year={1998}, pages={777–789} }
Metadata:Crossref

Access the Paper

This paper is available from its original source. Click below to access the PDF.

Open PDF