Dark silicon and the end of multicore scaling

H. EsmaeilzadehEmily R. BlemRenée St. AmantKarthikeyan SankaralingamD. Burger

article2011ISCA2,221 citationsIEEE Micro Top Picks, Communications of the ACM Research Highlights

Demonstrates through empirical modeling across CPU and GPU topologies that the breakdown of Dennard scaling forces over half of future chip area to remain unpowered dark silicon, severely limiting multicore speedups to well below historical Moore's Law projections.

Listen

For decades, semiconductor progress relied on simultaneously shrinking transistors and increasing energy efficiency. However, the breakdown of voltage scaling has created severe power constraints for modern microprocessors. The computing industry pivoted toward multicore designs to sustain historical performance growth, but growing power density threatens to stall this approach as well.

This article evaluates how much performance improvement multicore scaling can deliver across future technology generations and measures the extent of unpowered chip area, known as dark silicon. The goal was to determine whether simply adding more processor cores remains a viable long-term strategy for computing hardware.

To conduct this assessment, the article combined device-level scaling roadmaps with empirical data from over 150 real-world processors to establish optimal power, area, and performance frontiers. The authors then built an analytical modeling framework to evaluate multiple chip organizations and topologies across realistic parallel workloads from the standard benchmark suite, maintaining fixed chip area and power constraints through future technology nodes down to 8 nanometers.

The findings show that multicore scaling will fall dramatically short of historical growth expectations. Under optimistic industry projections, processor performance will improve by an average of only 7.9 times over five technology generations, leaving a nearly 24-fold shortfall compared to historical performance doubling targets. Under more conservative projections, average performance improves by only 3.7 times. Power constraints directly force severe chip underutilization: at the 22-nanometer node, at least 21% of a chip must remain unpowered dark silicon, rising to more than 50% at 8 nanometers. Furthermore, neither massively threaded graphic architectures nor topology variations such as asymmetric or dynamic designs can close this performance gap.

These results demonstrate that the multicore era cannot sustain the historical economics of semiconductor scaling. Without major shifts, the semiconductor industry faces a severe return-on-investment wall where manufacturing smaller transistors yields diminishing practical performance gains.

To prevent performance stagnation, computer architects and hardware developers must move beyond adding standard processor cores. The article recommends pursuing radical architectural innovations, such as highly specialized accelerators and alternative low-power microarchitectures, to fundamentally shift energy-efficiency frontiers.

These projections rely on optimistic assumptions, including idealized thread parallelism, zero synchronization overheads, and favorable memory scaling. In real deployments, memory bottlenecks and non-core component power will likely degrade performance further. The conclusions therefore provide a reliable, robust upper bound, confirming with high confidence that traditional multicore scaling cannot maintain historical computing growth.

  • Paper: Real-time dynamic voltage scaling for low-power embedded operating systems, Padmanabhan Pillai et al. (2001). Its deadline-aware voltage-scaling algorithms show how reducing processor voltage and frequency trades performance for energy, grounding the power constraint that motivates dark-silicon analysis.
  • Paper: Scheduling for reduced CPU energy, Mark Weiser et al. (1994). Its operating-system approach to dynamic CPU speed and voltage adjustment makes the energy benefits—and performance costs—of voltage scaling concrete before the source examines their hardware limits.
Cover for Dark silicon and the end of multicore scaling

Abstract

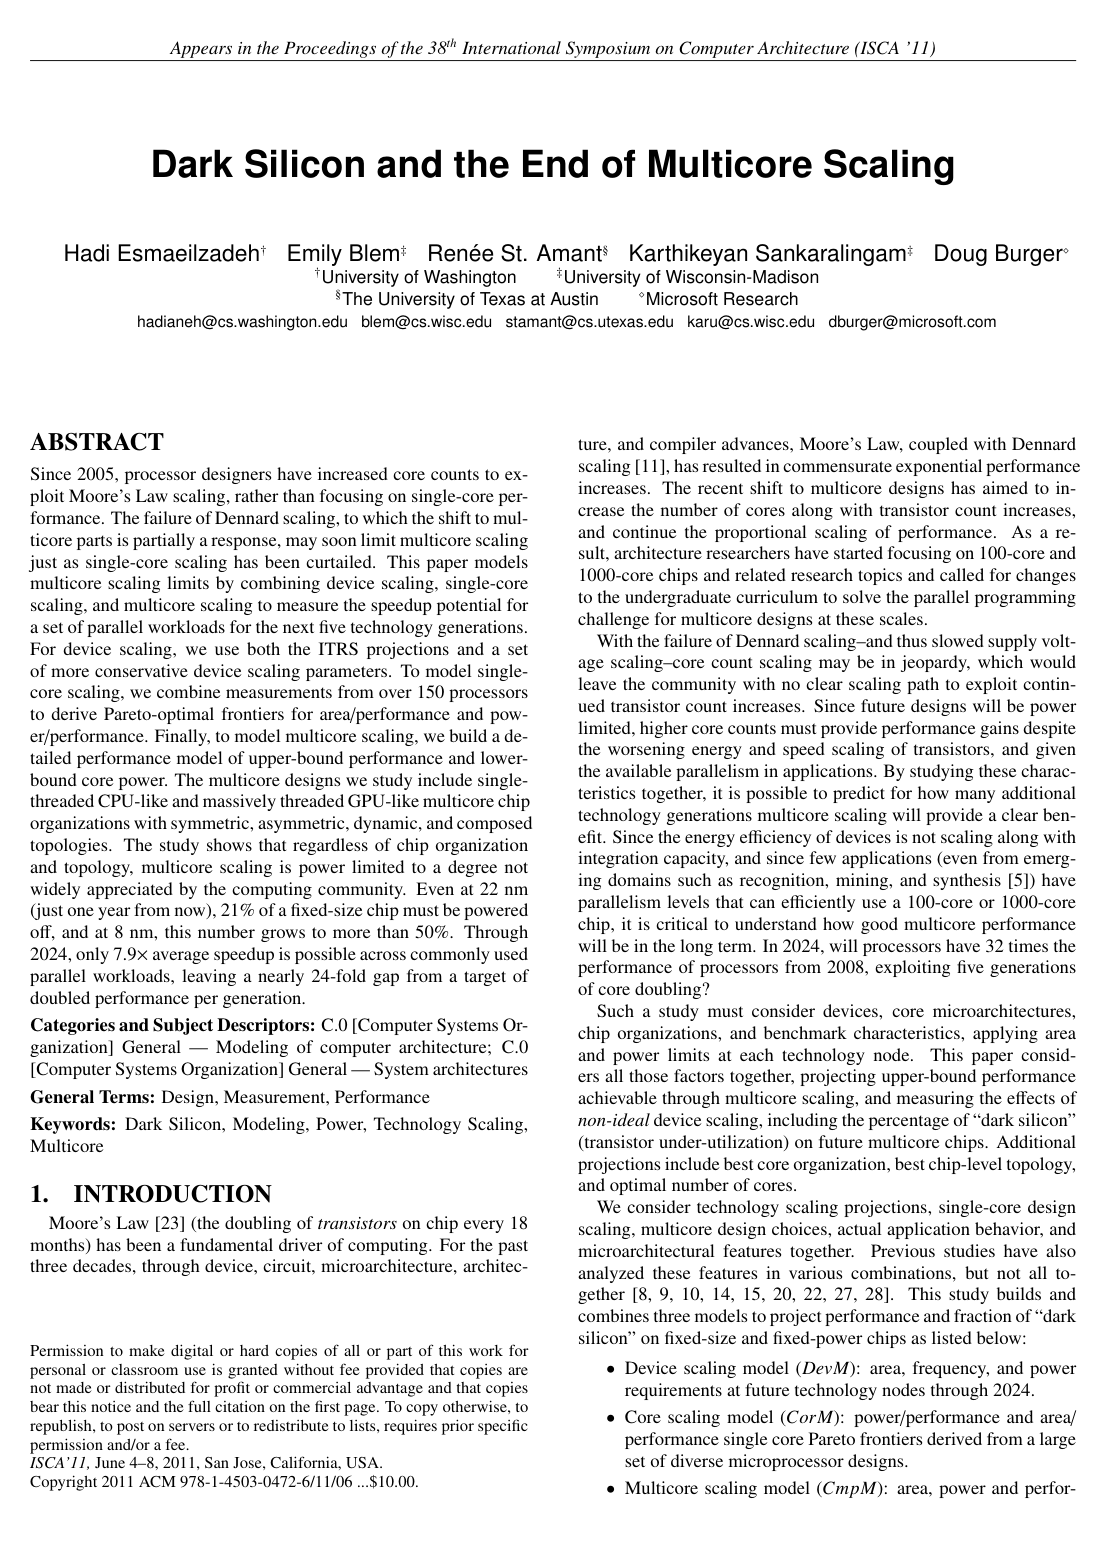
Since 2005, processor designers have increased core counts to exploit Moore’s Law scaling, rather than focusing on single-core performance. The failure of Dennard scaling, to which the shift to multicore parts is partially a response, may soon limit multicore scaling just as single-core scaling has been curtailed. This paper models multicore scaling limits by combining device scaling, single-core scaling, and multicore scaling to measure the speedup potential for a set of parallel workloads for the next five technology generations. For device scaling, we use both the ITRS projections and a set of more conservative device scaling parameters. To model single-core scaling, we combine measurements from over 150 processors to derive Pareto-optimal frontiers for area/performance and power/performance. Finally, to model multicore scaling, we build a detailed performance model of upper-bound performance and lower-bound core power. The multicore designs we study include single-threaded CPU-like and massively threaded GPU-like multicore chip organizations with symmetric, asymmetric, dynamic, and composed topologies. The study shows that regardless of chip organization and topology, multicore scaling is power limited to a degree not widely appreciated by the computing community. Even at 22 nm (just one year from now), 21% of a fixed-size chip must be powered off, and at 8 nm, this number grows to more than 50%. Through 2024, only 7.9× average speedup is possible across commonly used parallel workloads, leaving a nearly 24-fold gap from a target of doubled performance per generation.

Table of Contents

  • 1. INTRODUCTION
  • 2. OVERVIEW
  • 3. DEVICE MODEL
  • 4. CORE MODEL
  • 4.1 Decoupling Area and Power Constraints
  • 4.2 Pareto Frontier Derivation
  • 4.3 Device Scaling Core Scaling
  • 5. MULTICORE MODEL
  • 5.1 Amdahl's Law Upper-bounds: CmpMU
  • 5.2 Realistic Performance Model: CmpMR
  • Microarchitectural Features
  • Application Behavior
  • Multicore Topologies
  • Physical Constraints
  • Model Assumptions
  • Model Validation
  • 6. DEVICE CORE CMPSCALING
  • 7. SCALING AND FUTURE MULTICORES
  • 7.1 Upper-bound Analysis using Amdahl's Law
  • 7.2 Analysis using Real Workloads
  • 7.3 Sources of Dark Silicon
  • 7.4 Sensitivity Studies
  • 7.5 Summary
  • 7.6 Limitations
  • 8. RELATED WORK
  • 9. CONCLUSIONS
  • 10. ACKNOWLEDGMENTS
  • References

Knowls

  1. Knowl 1 — Upper-Bound Power- and Area-Constrained Multicore Scaling Model (CmpMU)

    theoretical result

    An analytical upper-bound multicore performance model (CmpMU\text{CmpM}_U) extends Amdahl's Law by incorporating decoupled total chip power (TDP\text{TDP}) and total chip die area (DIEAREA\text{DIE}_{\text{AREA}}) constraints. For a core characterized by single-thread performance qq (measured in SPEC CPU2006 marks), area function A(q)A(q), and power function P(q)P(q), the upper-bound single-core speedup relative to a baseline core with performance qBaselineq_{\text{Baseline}} is defined as SU(q)=q/qBaselineS_U(q) = q / q_{\text{Baseline}}.

    For an application workload with parallel code fraction f∈[0,1]f \in [0, 1] (where 1−f1 - f is the serial code fraction), the maximum core count and overall speedup across four chip topologies are:

    1. Symmetric Multicore (all identical cores sharing area and power equally): NSym(q)=min⁡(DIEAREAA(q),TDPP(q))N_{\text{Sym}}(q) = \min\left( \frac{\text{DIE}_{\text{AREA}}}{A(q)}, \frac{\text{TDP}}{P(q)} \right) SpeedupSym(f,q)=11−fSU(q)+fNSym(q)SU(q)\text{Speedup}_{\text{Sym}}(f, q) = \frac{1}{\frac{1 - f}{S_U(q)} + \frac{f}{N_{\text{Sym}}(q) S_U(q)}}

    2. Asymmetric Multicore (one large monolithic core with performance qLq_L and NAsymN_{\text{Asym}} small cores with performance qSq_S, where all cores execute parallel sections): NAsym(qL,qS)=min⁡(DIEAREA−A(qL)A(qS),TDP−P(qL)P(qS))N_{\text{Asym}}(q_L, q_S) = \min\left( \frac{\text{DIE}_{\text{AREA}} - A(q_L)}{A(q_S)}, \frac{\text{TDP} - P(q_L)}{P(q_S)} \right) SpeedupAsym(f,qL,qS)=11−fSU(qL)+fNAsym(qL,qS)SU(qS)+SU(qL)\text{Speedup}_{\text{Asym}}(f, q_L, q_S) = \frac{1}{\frac{1 - f}{S_U(q_L)} + \frac{f}{N_{\text{Asym}}(q_L, q_S) S_U(q_S) + S_U(q_L)}}

    3. Dynamic Multicore (one large core active during serial execution while small cores are powered off; small cores active during parallel execution while the large core is powered off): NDyn(qL,qS)=min⁡(DIEAREA−A(qL)A(qS),TDPP(qS))N_{\text{Dyn}}(q_L, q_S) = \min\left( \frac{\text{DIE}_{\text{AREA}} - A(q_L)}{A(q_S)}, \frac{\text{TDP}}{P(q_S)} \right) SpeedupDyn(f,qL,qS)=11−fSU(qL)+fNDyn(qL,qS)SU(qS)\text{Speedup}_{\text{Dyn}}(f, q_L, q_S) = \frac{1}{\frac{1 - f}{S_U(q_L)} + \frac{f}{N_{\text{Dyn}}(q_L, q_S) S_U(q_S)}}

    4. Composed Multicore (small cores dynamically fused into a high-performance large core during serial execution with composability area overhead factor τ\tau): NComposed(qL,qS)=min⁡(DIEAREA(1+τ)A(qS),TDP−P(qL)P(qS))N_{\text{Composed}}(q_L, q_S) = \min\left( \frac{\text{DIE}_{\text{AREA}}}{(1 + \tau) A(q_S)}, \frac{\text{TDP} - P(q_L)}{P(q_S)} \right) SpeedupComposed(f,qL,qS)=11−fSU(qL)+fNComposed(qL,qS)SU(qS)\text{Speedup}_{\text{Composed}}(f, q_L, q_S) = \frac{1}{\frac{1 - f}{S_U(q_L)} + \frac{f}{N_{\text{Composed}}(q_L, q_S) S_U(q_S)}}

    Here, τ\tau increases from 0.100.10 up to 4.004.00 depending on the total area of the composed core.

  2. Knowl 2 — Realistic Multicore Microarchitectural Performance Model (CmpMR)

    equation

    The realistic multicore performance model (CmpMR\text{CmpM}_R) computes execution throughput in instructions per second for fully parallel workloads (f=1f = 1) by capturing frequency, instruction-level parallelism, hardware multithreading, multi-level cache hierarchies, memory access stall latencies, and off-chip memory bandwidth limits:

    Perf=min⁡(NfreqCPIexeη,BWmax⁡rm×mL1×b)\text{Perf} = \min\left( N \frac{\text{freq}}{\text{CPI}_{\text{exe}}} \eta, \frac{\text{BW}_{\max}}{r_m \times m_{L1} \times b} \right)

    where:

    • NN is the number of active processor cores.
    • freq\text{freq} is the core clock frequency in Hz.
    • CPIexe\text{CPI}_{\text{exe}} is the cycles per instruction assuming zero-latency cache hits.
    • BWmax⁡\text{BW}_{\max} is the maximum off-chip memory bandwidth in bytes per second.
    • rmr_m is the fraction of dynamic instructions that are memory references (loads and stores).
    • bb is the cache line size in bytes per memory transaction (64 B64\text{ B}).
    • mL1m_{L1} is the local Level 1 cache miss rate.
    • η∈[0,1]\eta \in [0, 1] is the per-core thread utilization factor, given by: η=min⁡(1,T1+trmCPIexe)\eta = \min\left( 1, \frac{T}{1 + t \frac{r_m}{\text{CPI}_{\text{exe}}}} \right) where TT is the number of concurrent hardware threads per core, and tt is the average memory access stall time in cycles: t=(1−mL1)tL1+mL1(1−mL2)tL2+mL1mL2tmemt = (1 - m_{L1}) t_{L1} + m_{L1}(1 - m_{L2}) t_{L2} + m_{L1} m_{L2} t_{\text{mem}} with tL1t_{L1}, tL2t_{L2}, and tmemt_{\text{mem}} representing L1 access latency, L2 access latency, and main memory access latency in cycles.

    Cache miss rates mL1m_{L1} and mL2m_{L2} follow power-law behavior based on cache capacities and thread counts: mL1=(CL1TβL1)1−αL1,mL2=(CL2NTβL2)1−αL2m_{L1} = \left( \frac{C_{L1}}{T \beta_{L1}} \right)^{1 - \alpha_{L1}}, \quad m_{L2} = \left( \frac{C_{L2}}{N T \beta_{L2}} \right)^{1 - \alpha_{L2}} where CL1C_{L1} is the per-core L1 cache size (in bytes), CL2C_{L2} is the shared L2 cache size (in bytes), and αL1,βL1,αL2,βL2\alpha_{L1}, \beta_{L1}, \alpha_{L2}, \beta_{L2} are benchmark-specific cache constants.

    For an application with parallel fraction ff, serial throughput PerfS\text{Perf}_S, parallel throughput PerfP\text{Perf}_P, and baseline single-core performance PerfB\text{Perf}_B, serial and parallel speedups are SR,Serial=PerfS/PerfBS_{R,\text{Serial}} = \text{Perf}_S / \text{Perf}_B and SR,Parallel=PerfP/PerfBS_{R,\text{Parallel}} = \text{Perf}_P / \text{Perf}_B. The realistic overall application speedup is: SpeedupR=11−fSR,Serial+fSR,Parallel\text{Speedup}_R = \frac{1}{\frac{1 - f}{S_{R,\text{Serial}}} + \frac{f}{S_{R,\text{Parallel}}}}

  3. Knowl 3 — Empirical Single-Core Power and Area Pareto Frontiers at 45 nm (CorM)

    model/method

    To model single-core design tradeoffs while decoupling area and power constraints (moving beyond Pollack's rule alone), empirical single-thread performance qq (in SPEC CPU2006 marks), core area A(q)A(q) (in mm2\text{mm}^2, excluding L2 and L3 caches), and thermal design power P(q)P(q) (in Watts allocated to core logic) were compiled for 152 microprocessors from 600 nm to 45 nm, and fit to 20 representative Intel and AMD processors at 45 nm.

    The resulting Pareto-optimal frontier functions enclosing all efficient 45 nm single-core processor designs are:

    • Power/Performance Pareto Frontier: P(q)=0.0002q3+0.0009q2+0.3859q−0.0301P(q) = 0.0002 q^3 + 0.0009 q^2 + 0.3859 q - 0.0301 where P(q)P(q) is core logic power in Watts, and qq is single-thread SPECmark performance.

    • Area/Performance Pareto Frontier: A(q)=0.0152q2+0.0265q+7.4393A(q) = 0.0152 q^2 + 0.0265 q + 7.4393 where A(q)A(q) is core logic area in mm2\text{mm}^2.

    In these equations, 20% of the core power budget is allocated to leakage power and 80% to dynamic power. The design space is bounded on the lower-left by the Intel Atom Z520 (1.89 W1.89\text{ W} core power, 2.2 W2.2\text{ W} chip TDP) and on the upper-right by the Intel Nehalem Core i7-965 Extreme Edition (31.25 W31.25\text{ W} core power per core, 130 W130\text{ W} chip TDP).

  4. Knowl 4 — Device Technology Scaling Parameters (DevM)

    data/table

    The device scaling model incorporates two technology scaling projections from 45 nm down to 8 nm: the International Technology Roadmap for Semiconductors (ITRS 2010 update, assuming FinFET multi-gate transistors replace planar bulk at ≤22 nm\le 22\text{ nm}) and a conservative scaling model based on historical semiconductor trends (Borkar).

    Scaling Model Year Node (nm) Freq. Factor VddV_{dd} Factor Cap. Factor Power Factor
    ITRS 2010 45 1.00 1.00 1.00 1.00
    ITRS 2012 32 1.09 0.93 0.70 0.66
    ITRS 2015 22 2.38 0.84 0.33 0.54
    ITRS 2018 16 3.21 0.75 0.21 0.38
    ITRS 2021 11 4.17 0.68 0.13 0.25
    ITRS 2024 8 3.85 0.62 0.08 0.12
    Conservative 2008 45 1.00 1.00 1.00 1.00
    Conservative 2010 32 1.10 0.93 0.75 0.71
    Conservative 2012 22 1.19 0.88 0.56 0.52
    Conservative 2014 16 1.25 0.86 0.42 0.39
    Conservative 2016 11 1.30 0.84 0.32 0.29
    Conservative 2018 8 1.34 0.84 0.24 0.22

    Under ITRS projections, microarchitectures achieve a 3.9×3.9\times performance increase and an 88%88\% power reduction from 45 nm to 8 nm (averaging a 31% frequency increase and 35% power reduction per node). Under conservative scaling, performance increases by 34%34\% and power decreases by 74%74\% from 45 nm to 8 nm (averaging a 6% frequency increase and 23% power reduction per node). Dynamic power scales with αCVdd2f\alpha C V_{dd}^2 f, while frequency scales with FO4 inverter delay.

  5. Knowl 5 — Optimal Multicore Configuration and Dark Silicon Search Algorithm

    algorithm

    To determine the optimal core microarchitecture, optimal number of cores, maximum speedup, and fraction of dark silicon at each technology node, an exhaustive state-space search explores the discretized Pareto frontiers subject to a fixed core die area budget (DIEAREA=111 mm2\text{DIE}_{\text{AREA}} = 111\text{ mm}^2, the area of 4 Nehalem cores at 45 nm excluding L2/L3 caches) and a fixed core thermal power budget (TDP=125 W\text{TDP} = 125\text{ W}, the core power budget of a 4-core Nehalem multicore at 45 nm).

    Input: Scaled Pareto frontier points (Ai,Pi,qi)i=1100{(A_i, P_i, q_i)}_{i=1}^{100}, chip budgets DIEAREA=111 mm2\text{DIE}_{\text{AREA}} = 111\text{ mm}^2, TDP=125 W\text{TDP} = 125\text{ W}, benchmark parameters (f,CPIexe,rm,cache constantsf, \text{CPI}_{\text{exe}}, r_m, \text{cache constants})
    Output: Optimal core index i∗i^*, optimal core count N∗N^*, maximum speedup S∗S^*, dark silicon percentage D∗D^*
    Initialize S∗←0S^* \leftarrow 0, N∗←0N^* \leftarrow 0, D∗←0D^* \leftarrow 0, i∗←1i^* \leftarrow 1
    for each design point i∈{1,…,100}i \in \{1, \dots, 100\} on the Pareto frontier do
        N←1N \leftarrow 1
        Sprev←0S_{\text{prev}} \leftarrow 0
        while true do
            Compute total core area Atotal(N,Ai)A_{\text{total}}(N, A_i) and total core power Ptotal(N,Pi)P_{\text{total}}(N, P_i)
            if Atotal>DIEAREAA_{\text{total}} > \text{DIE}_{\text{AREA}} or Ptotal>TDPP_{\text{total}} > \text{TDP} then
                break
            end if
            Compute multicore speedup S(N,i)S(N, i) using CmpMU\text{CmpM}_U or CmpMR\text{CmpM}_R relative to a 4-core 45 nm Nehalem
            if N>1N > 1 and S(N,i)<Sprev×1.10S(N, i) < S_{\text{prev}} \times 1.10 and NN is a doubling step then
                // Enforce that doubling core count must yield at least a 10% performance increase
            end if
            Sprev←S(N,i)S_{\text{prev}} \leftarrow S(N, i)
            if S(N,i)>S∗S(N, i) > S^* then
                S∗←S(N,i)S^* \leftarrow S(N, i)
                N∗←NN^* \leftarrow N
                i∗←ii^* \leftarrow i
                D∗←1.0−(Atotal(N,Ai)/DIEAREA)D^* \leftarrow 1.0 - (A_{\text{total}}(N, A_i) / \text{DIE}_{\text{AREA}})
            end if
            N←N+1N \leftarrow N + 1
        end while
    end for
    return (i∗,N∗,S∗,D∗)(i^*, N^*, S^*, D^*)
  6. Knowl 6 — Projected Multicore Speedup and Dark Silicon Scaling Limits

    empirical result

    Evaluation of the PARSEC benchmark suite across technology nodes from 45 nm down to 8 nm under fixed area (111 mm2111\text{ mm}^2) and power (125 W125\text{ W}) constraints demonstrates strict scaling limits:

    1. Speedup Gap: For realistic CPU-like multicores under optimistic ITRS scaling, the geometric mean speedup across PARSEC benchmarks at 8 nm (in 2024) is 7.9×7.9\times for dynamic topologies and 7.7×7.7\times for symmetric topologies (with a maximum single-benchmark speedup of 46.6×46.6\times). This leaves a nearly 24×24\times gap compared to the historical Moore's Law expectation of 32×32\times performance growth across five technology generations. Under conservative device scaling, geometric mean speedup reaches only 3.5×3.5\times at 8 nm (10.9×10.9\times maximum), leaving a 22×22\times shortfall.
    2. Dark Silicon Proportions: Power constraints prevent scaling core counts to fill the available chip area. Under ITRS scaling, the geometric mean of dark silicon across PARSEC benchmarks is 21% of core area at 22 nm (2012) and exceeds 50% at 8 nm (2024). Under conservative scaling, dark silicon dominates starting at 16 nm (2016) for CPU organizations and at 22 nm (2012) for GPU organizations.
    3. GPU-Like Multicores: GPU-like organizations achieve a geometric mean speedup of only 2.7×2.7\times at 8 nm across PARSEC workloads (11.2×11.2\times maximum) under ITRS scaling, severely constrained by low single-thread performance on serial sections and memory bandwidth bottlenecks.
  7. Knowl 7 — Multicore Topologies and CPU vs. GPU Chip Organizations

    definition

    Multicore scaling is categorized into two chip organizations and four topological configurations:

    • Chip Organizations:

      • CPU-like Multicore: Utilizes heavyweight single-threaded (ST) cores featuring large private L1 caches (64 KB64\text{ KB} per core), high clock frequencies, out-of-order execution, and a shared chip-level L2 cache occupying 30% of total die area.
      • GPU-like Multicore: Utilizes lightweight many-threaded (MT) cores with small L1 caches (32 KB32\text{ KB} shared per 8 cores), hardware multithreading (1024 thread contexts per 8 cores), a dedicated thread register file, and no on-chip L2 cache. Eight MT cores along with their shared L1 cache and register file occupy the same area and power footprint as a single 45 nm Intel Atom core.
    • Multicore Topologies:

      • Symmetric (Homogeneous): Replicates identical cores sharing area and power budgets equally. Serial code runs on one core while all NN cores execute parallel code at identical voltage and frequency settings.
      • Asymmetric: Composed of one large high-performance ST core and NN small cores. The large core executes serial code, while the large core and all NN small cores execute parallel code concurrently.
      • Dynamic: Composed of one large ST core and NN small cores. During serial execution, the small cores are powered off and only the large core runs; during parallel execution, the large core is powered off and all NN small cores run.
      • Composed (Fused): Composed of NN small cores that dynamically fuse into one logical high-performance core during serial phases (subject to an area overhead factor τ∈[0.10,4.00]\tau \in [0.10, 4.00] per small core) and execute independently as individual cores during parallel phases.
  8. Knowl 8 — Primary Sources of Dark Silicon: Parallelism vs. Power Limits

    empirical result

    Decoupled constraint experiments on PARSEC benchmarks at the 8 nm node isolate whether application parallelism or power dissipation is the primary driver of dark silicon:

    1. Power-Only Constrained (Parallelism Relaxed): Holding the chip power budget constant at 125 W125\text{ W} while artificially sweeping workload parallel fraction ff from actual levels up to 99% (f=0.99f = 0.99) increases speedup slowly, with most PARSEC benchmarks reaching only ≈15×\approx 15\times speedup over a 45 nm quad-core Nehalem under ITRS scaling (6.3×6.3\times under conservative scaling).
    2. Parallelism-Only Constrained (Power Relaxed): Sweeping the power budget from 50 W50\text{ W} to 500 W500\text{ W} (relaxing the power wall) reveals that 8 out of 12 PARSEC benchmarks cannot exceed 10×10\times speedup even with practically unlimited power due to Amdahl's Law constraints on the serial code fraction.
    3. Conclusion: For the majority of parallel benchmarks, insufficient parallelism is the primary contributor to dark silicon. For the four benchmarks that have sufficient parallelism (f>0.99f > 0.99) to hypothetically track Moore's Law speedups, power dissipation limits enforce dark silicon and prevent realization of these speedups.
  9. Knowl 9 — Sensitivity of Multicore Speedup to L2 Cache Allocation and Memory Bandwidth

    empirical result

    Sensitivity studies on symmetric multicore configurations at 45 nm evaluate whether non-core microarchitectural adjustments overcome scaling limits:

    1. L2 Cache Area Sensitivity: Sweeping the fraction of chip area dedicated to shared L2 cache from 0% to 100% on CPU multicores shows that the optimal cache allocation ranges between 20% and 50% across PARSEC benchmarks. However, tuning cache allocation from a baseline 30% to the benchmark-specific optimum yields at most a 20% performance improvement across all workloads.
    2. Memory Bandwidth Sensitivity: Scaling off-chip memory bandwidth from the baseline 200 GB/s200\text{ GB/s} up to 1000 GB/s1000\text{ GB/s} on GPU multicores improves thread data supply, but speedup gains remain severely restricted by power and parallelism limits: 10 of the 12 PARSEC benchmarks improve speedup by less than 2×2\times relative to the 200 GB/s200\text{ GB/s} baseline.
  10. Knowl 10 — Validation and Optimistic Assumptions of the Multicore Scaling Model

    limitation

    The multicore performance model (CmpMR\text{CmpM}_R) provides an optimistic upper bound on performance due to specific modeling simplifications and validations:

    • System Validation: CPU speedup projections match empirical PARSEC measurements on a physical quad-Pentium 4 CMP. GPU performance projections validated against cycle-accurate GPGPUSim simulations (evaluating 224-core vs. 32-core configurations across 12 CUDA benchmarks) and physical NVIDIA GeForce 8600 GTS measurements consistently over-predict raw performance (GOPS) and speedup.
    • Optimistic Simplifications:
      • Zero memory contention, zero interconnection network latency, and zero thread-swapping overhead.
      • Zero overhead for thread synchronization, barrier communication, and OS scheduling serialization.
      • Clock frequency scales linearly with processor single-thread performance without memory latency degradation.
      • Uncore power consumption (interconnects, memory controllers, shared caches) is excluded from the core power budget, leaving the entire 125 W budget to logic cores.
    • Simultaneous Multithreading (SMT): Incorporating SMT with zero area or power overhead alters speedup by 0.6×0.6\times to 1.5×1.5\times for 2-way SMT and 0.3×0.3\times to 2.5×2.5\times for 8-way SMT due to private cache thrashing and contention.

Coverage note — None was omitted; all contributed models (DevM, CorM, CmpMU, CmpMR), technology scaling data, search algorithms, empirical speedup and dark silicon projections, topology definitions, bottleneck analyses, and sensitivity studies are included.

References

  1. 1.G. M. Amdahl. Validity of the single processor approach to achieving large-scale computing capabilities. In AFIPS ’67.
  2. 2.O. Azizi, A. Mahesri, B. C. Lee, S. J. Patel, and M. Horowitz. Energy-performance tradeoffs in processor architecture and circuit design: a marginal cost analysis. In ISCA ’10.
  3. 3.A. Bakhoda, G. L. Yuan, W. W. L. Fung, H. Wong, and T. M. Aamodt. Analyzing CUDA workloads using a detailed GPU simulator. In ISPASS ’09.
  4. 4.M. Bhadauria, V. Weaver, and S. McKee. Understanding PARSEC performance on contemporary CMPs. In IISWC ’09.
  5. 5.C. Bienia, S. Kumar, J. P. Singh, and K. Li. The PARSEC benchmark suite: Characterization and architectural implications. In PACT ’08.
  6. 6.S. Borkar. Thousand core chips: a technology perspective. In DAC ’07.
  7. 7.S. Borkar. The exascale challenge. Keynote at International Symposium on VLSI Design, Automation and Test (VLSI-DAT), 2010.
  8. 8.K. Chakraborty. Over-provisioned Multicore Systems. PhD thesis, University of Wisconsin-Madison, 2008.
  9. 9.S. Cho and R. Melhem. Corollaries to Amdahl’s law for energy. Computer Architecture Letters, 7(1), January 2008.
  10. 10.E. S. Chung, P. A. Milder, J. C. Hoe, and K. Mai. Single-chip heterogeneous computing: Does the future include custom logic, FPGAs, and GPUs? In MICRO ’10.
  11. 11.R. H. Dennard, F. H. Gaensslen, V. L. Rideout, E. Bassous, and A. R. LeBlanc. Design of ion-implanted mosfet’s with very small physical dimensions. IEEE Journal of Solid-State Circuits, 9, October 1974.
  12. 12.H. Esmaeilzadeh, T. Cao, Y. Xi, S. M. Blackburn, and K. S. McKinley. Looking back on the language and hardware revolutions: measured power, performance, and scaling. In ASPLOS ’11.
  13. 13.Z. Guz, E. Bolotin, I. Keidar, A. Kolodny, A. Mendelson, and U. C. Weiser. Many-core vs. many-thread machines: Stay away from the valley. IEEE Computer Architecture Letters, 8, January 2009.
  14. 14.M. Hempstead, G.-Y. Wei, and D. Brooks. Navigo: An early-stage model to study power-contrained architectures and specialization. In MoBS ’09.
  15. 15.M. D. Hill and M. R. Marty. Amdahl’s law in the multicore era. Computer, 41(7), July 2008.
  16. 16.M. Horowitz, E. Alon, D. Patil, S. Naffziger, R. Kumar, and K. Bernstein. Scaling, power, and the future of CMOS. In IEDM ’05.
  17. 17.E. Ipek, M. Kirman, N. Kirman, and J. F. Martinez. Core fusion: accommodating software diversity in chip multiprocessors. In ISCA ’07.
  18. 18.ITRS. International technology roadmap for semiconductors, 2010 update, 2011. URL http://www.itrs.net.
  19. 19.C. Kim, S. Sethumadhavan, M. S. Govindan, N. Ranganathan, D. Gulati, D. Burger, and S. W. Keckler. Composable lightweight processors. In MICRO ’07.
  20. 20.J.-G. Lee, E. Jung, and W. Shin. An asymptotic performance/energy analysis and optimization of multi-core architectures. In ICDCN ’09, .
  21. 21.V. W. Lee et al. Debunking the 100X GPU vs. CPU myth: an evaluation of throughput computing on CPU and GPU. In ISCA ’10, .
  22. 22.G. Loh. The cost of uncore in throughput-oriented many-core processors. In ALTA ’08.
  23. 23.G. E. Moore. Cramming more components onto integrated circuits. Electronics, 38(8), April 1965.
  24. 24.K. Nose and T. Sakurai. Optimization of VDD and VTH for low-power and high speed applications. In ASP-DAC ’00.
  25. 25.SPEC. Standard performance evaluation corporation, 2011. URL http://www.spec.org.
  26. 26.A. M. Suleman, O. Mutlu, M. K. Qureshi, and Y. N. Patt. Accelerating critical section execution with asymmetric multicore architectures. In ASPLOS ’09.
  27. 27.G. Venkatesh, J. Sampson, N. Goulding, S. Garcia, V. Bryksin, J. Lugo-Martinez, S. Swanson, and M. B. Taylor. Conservation cores: reducing the energy of mature computations. In ASPLOS ’10.
  28. 28.D. H. Woo and H.-H. S. Lee. Extending Amdahl’s law for energy-efficient computing in the many-core era. Computer, 41(12), December 2008.

Citation

MLA
Esmaeilzadeh, H., et al. “Dark Silicon and the End of Multicore Scaling”. Proceedings of the 38th Annual International Symposium on Computer Architecture, 2011, pp. 365–76, https://doi.org/10.1145/2000064.2000108.
APA
Esmaeilzadeh, H., Blem, E., St. Amant, R., Sankaralingam, K., & Burger, D. (2011). Dark silicon and the end of multicore scaling. Proceedings of the 38th Annual International Symposium on Computer Architecture, 365–376. https://doi.org/10.1145/2000064.2000108
Chicago
Esmaeilzadeh, H., E. Blem, R. St. Amant, K. Sankaralingam, and D. Burger. 2011. “Dark Silicon and the End of Multicore Scaling”. Proceedings of the 38th Annual International Symposium on Computer Architecture, 365–76. https://doi.org/10.1145/2000064.2000108.
Harvard
Esmaeilzadeh, H. et al. (2011) “Dark silicon and the end of multicore scaling”, Proceedings of the 38th annual international symposium on Computer architecture. ACM, pp. 365–376. Available at: https://doi.org/10.1145/2000064.2000108.
Vancouver
1. Esmaeilzadeh H, Blem E, St. Amant R, Sankaralingam K, Burger D (2011) Dark silicon and the end of multicore scaling. In: Proceedings of the 38th annual international symposium on Computer architecture. ACM, pp 365–376

BibTeX

@inproceedings{Esmaeilzadeh_2011, series={ISCA ’11}, title={Dark silicon and the end of multicore scaling}, url={http://dx.doi.org/10.1145/2000064.2000108}, DOI={10.1145/2000064.2000108}, booktitle={Proceedings of the 38th annual international symposium on Computer architecture}, publisher={ACM}, author={Esmaeilzadeh, Hadi and Blem, Emily and St. Amant, Renee and Sankaralingam, Karthikeyan and Burger, Doug}, year={2011}, month=June, pages={365–376}, collection={ISCA ’11} }
Metadata:Crossref

Access the Paper

This paper is available from its original source. Click below to access the PDF.

Open PDF