Towards Total Recall in Industrial Anomaly Detection

Karsten RothLatha PemulaJoaquin ZepedaBernhard SchölkopfThomas BroxPeter Gehler

article2021CVPR1,855 citationsEMVA European Machine Vision Award

Introduces PatchCore, an industrial anomaly detection method that leverages a representative memory bank of patch features to more than halve error rates on the standard MVTec AD benchmark while maintaining fast inference speeds.

Listen

Visual defect inspection is essential in manufacturing, but modern production environments frequently face a cold-start problem where normal product images are abundant while defect examples are rare and unpredictable. Existing machine learning methods often struggle to detect diverse, subtle defects or suffer from slow processing speeds, heavy bias toward general natural image datasets, and rigid alignment constraints.

To address these operational challenges, the article evaluates PatchCore, a memory-bank anomaly detection and localization algorithm. The objective was to demonstrate that extracting and compressing representative, locally aware visual features from normal images can maximize defect detection accuracy while maintaining fast inference speeds and high sample efficiency.

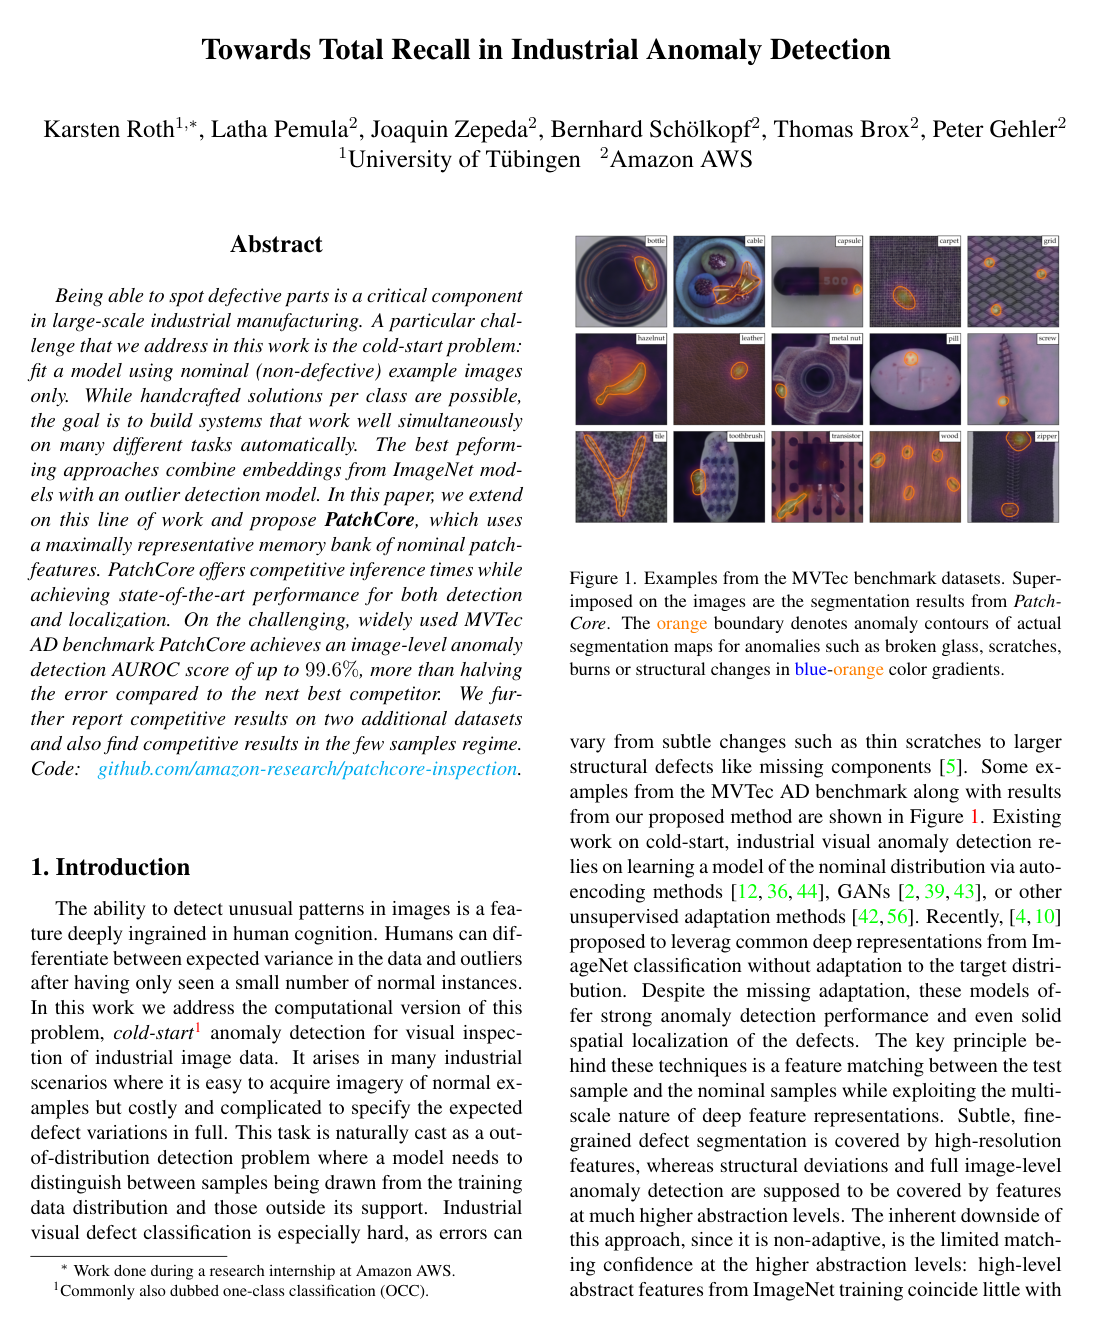
The authors conducted comprehensive evaluations primarily on the widely used MVTec Anomaly Detection benchmark, consisting of 5,354 industrial images across 15 product categories, alongside secondary benchmarks on magnetic tile surface defects and campus surveillance footage. The approach leverages intermediate feature representations from standard pre-trained vision models, aggregates surrounding local spatial context, and applies a greedy subset selection method to drastically reduce memory usage and runtime without losing detection power.

The analysis produced several critical findings. First, PatchCore achieved state-of-the-art image-level anomaly detection accuracy on the MVTec benchmark, reaching up to a 99.6% detection score and reducing classification error by over 50% compared to previous leading methods. Second, it delivered superior pixel-level defect localization, accurately outlining flaws ranging from fine scratches to missing structural components. Third, the data reduction technique allowed the model to discard up to 99% of the stored features while preserving full detection performance and cutting inference time to under 0.2 seconds per image. Fourth, the system showed remarkable sample efficiency, matching previous benchmark performance while requiring as little as one-fifth of the standard training sample size.

These results demonstrate that industrial facilities can deploy highly sensitive quality inspection systems without requiring time-consuming defect data collection, costly manual model tuning, or specialized retraining for each production line. By operating directly on mid-level visual features, PatchCore minimizes false alarms and inspection latency, offering significant opportunities to lower operational costs, improve quality assurance, and shorten line-deployment timelines.

Organizations evaluating automated visual inspection should consider piloting this patch-based framework for cold-start production scenarios. For operational deployments, teams can utilize aggressive feature subsampling to achieve fast, low-latency processing on standard hardware, or scale to higher image resolutions and model ensembles when maximum defect recall is paramount.

While confidence in these findings is reinforced by rigorous testing across diverse object and texture datasets, the system’s performance fundamentally relies on the visual representations learned by the underlying pre-trained network. Practitioners should exercise caution in specialized domains where surface appearances deviate drastically from standard visual features, and future development should explore combining this patch retrieval approach with domain-specific feature adaptation.

No sufficiently relevant recommendations were found.
Cover for Towards Total Recall in Industrial Anomaly Detection

Abstract

Being able to spot defective parts is a critical component in large-scale industrial manufacturing. A particular challenge that we address in this work is the cold-start problem: fit a model using nominal (non-defective) example images only. While handcrafted solutions per class are possible, the goal is to build systems that work well simultaneously on many different tasks automatically. The best performing approaches combine embeddings from ImageNet models with an outlier detection model. In this paper, we extend on this line of work and propose \textbf{PatchCore}, which uses a maximally representative memory bank of nominal patch-features. PatchCore offers competitive inference times while achieving state-of-the-art performance for both detection and localization. On the challenging, widely used MVTec AD benchmark PatchCore achieves an image-level anomaly detection AUROC score of up to 99.6%99.6\%, more than halving the error compared to the next best competitor. We further report competitive results on two additional datasets and also find competitive results in the few samples regime.\freefootnote{∗^* Work done during a research internship at Amazon AWS.} Code: this http URL.

Table of Contents

  • 1 Introduction
  • 2 Related Works
  • 3 Method
  • 3.1 Locally aware patch features
  • 3.2 Coreset-reduced patch-feature memory bank
  • 3.3 Anomaly Detection with PatchCore
  • 4 Experiments
  • 4.1 Experimental Details
  • 4.2 Anomaly Detection on MVTec AD
  • 4.3 Inference Time
  • 4.4 Ablations Study
  • 4.4.1 Locally aware patch-features and hierarchies
  • 4.4.2 Importance of Coreset subsampling
  • 4.5 Low-shot Anomaly Detection
  • 4.6 Evaluation on other benchmarks
  • 5 Conclusion
  • References
  • A Implementation Details
  • B Full MVTec AD comparison
  • C Additional Ablations & Details
  • C.1 Detailed Low-Shot experiments
  • C.2 Dependency on pretrained networks
  • C.3 Influence of image resolution
  • C.4 Remaining Misclassifications
  • C.5 Local Awareness and Subsampling

Knowls

  1. Knowl 1 — Locally Aware Patch-Feature Memory Bank Construction

    model/method

    PatchCore models the nominal data distribution by extracting and storing locally aggregated, mid-level patch features from a network ϕ\phi pretrained on ImageNet without adapting the network weights to the target data.

    Let XN\mathcal{X}_N denote the set of nominal training images (yx=0y_x = 0 for all x∈XNx \in \mathcal{X}_N). For an image xi∈XNx_i \in \mathcal{X}_N, let ϕi,j=ϕj(xi)∈Rc∗×h∗×w∗\phi_{i,j} = \phi_j(x_i) \in \mathbb{R}^{c^* \times h^* \times w^*} denote the feature map tensor at hierarchy level jj of ϕ\phi, where c∗c^*, h∗h^*, and w∗w^* are feature depth, height, and width, respectively. The feature vector at spatial location (h,w)(h, w) is denoted as ϕi,j(h,w)∈Rc∗\phi_{i,j}(h, w) \in \mathbb{R}^{c^*} for h∈{1,…,h∗}h \in \{1, \dots, h^*\} and w∈{1,…,w∗}w \in \{1, \dots, w^*\}.

    To enlarge the effective receptive field and impart robustness against minor spatial variations while maintaining spatial resolution, PatchCore aggregates features within an odd-sized patch neighborhood pp. The local neighborhood around coordinate (h,w)(h, w) is defined as:

    Np(h,w)={(a,b)  |  a∈[h−⌊p/2⌋,…,h+⌊p/2⌋],  b∈[w−⌊p/2⌋,…,w+⌊p/2⌋]}\mathcal{N}_p^{(h,w)} = \left\{ (a, b) \;\middle|\; a \in \left[ h - \lfloor p/2 \rfloor, \dots, h + \lfloor p/2 \rfloor \right], \; b \in \left[ w - \lfloor p/2 \rfloor, \dots, w + \lfloor p/2 \rfloor \right] \right\}

    The locally aware feature vector at position (h,w)(h, w) is computed via an aggregation function faggf_{\text{agg}} (implemented as adaptive average pooling):

    ϕi,j(Np(h,w))=fagg({ϕi,j(a,b)∣(a,b)∈Np(h,w)})\phi_{i,j}\left(\mathcal{N}_p^{(h,w)}\right) = f_{\text{agg}}\left( \left\{ \phi_{i,j}(a, b) \mid (a, b) \in \mathcal{N}_p^{(h,w)} \right\} \right)

    Applying this with a spatial stride parameter ss across the feature grid yields the patch-feature collection:

    Ps,p(ϕi,j)={ϕi,j(Np(h,w))  |  h,w mod s=0,  1≤h≤h∗,  1≤w≤w∗}\mathcal{P}_{s,p}(\phi_{i,j}) = \left\{ \phi_{i,j}\left(\mathcal{N}_p^{(h,w)}\right) \;\middle|\; h, w \bmod s = 0, \; 1 \le h \le h^*, \; 1 \le w \le w^* \right\}

    To combine spatial precision with sufficient context, PatchCore extracts features from two consecutive intermediate hierarchy levels, jj and j+1j+1 (typically the final outputs of blocks 2 and 3 of a ResNet-like architecture). The collection Ps,p(ϕi,j+1)\mathcal{P}_{s,p}(\phi_{i,j+1}) is bilinearly interpolated so that its spatial grid matches Ps,p(ϕi,j)\mathcal{P}_{s,p}(\phi_{i,j}), and corresponding patch vectors are concatenated into a single dd-dimensional representation. The complete nominal memory bank M\mathcal{M} over all nominal training images is:

    M=⋃xi∈XNPs,p(ϕ(xi))\mathcal{M} = \bigcup_{x_i \in \mathcal{X}_N} \mathcal{P}_{s,p}(\phi(x_i))

  2. Knowl 2 — Greedy Minimax Coreset Subsampling for Memory Bank Reduction

    algorithm

    To reduce inference time and memory storage while preserving nominal feature coverage, the memory bank M\mathcal{M} is subsampled to a coreset MC⊂M\mathcal{M}_C \subset \mathcal{M} with target size l=⌊percentage×∣M∣⌋l = \lfloor \text{percentage} \times |\mathcal{M}| \rfloor. The selection is formulated as a minimax facility location coreset problem:

    MC∗=arg⁡min⁡MC⊂Mmax⁡m∈Mmin⁡n∈MC∥m−n∥2\mathcal{M}_C^* = \arg\min_{\mathcal{M}_C \subset \mathcal{M}} \max_{m \in \mathcal{M}} \min_{n \in \mathcal{M}_C} \|m - n\|_2

    Because exact minimization is NP-hard, PatchCore uses an iterative greedy approximation. To accelerate distance evaluations during selection, patch representations m∈Rdm \in \mathbb{R}^d are projected into a lower-dimensional space Rd∗\mathbb{R}^{d^*} (d∗<dd^* < d) via a Johnson-Lindenstrauss random linear projection ψ:Rd→Rd∗\psi: \mathbb{R}^d \to \mathbb{R}^{d^*}.

    Input: Pretrained encoder ϕ\phi, feature hierarchies jj, nominal training set XN\mathcal{X}_N, stride ss, patch size pp, coreset target size ll, random linear projection ψ\psi.
    Output: Subsampled memory bank MC\mathcal{M}_C.
    M←∅\mathcal{M} \leftarrow \emptyset
    for xi∈XNx_i \in \mathcal{X}_N do
        M←M∪Ps,p(ϕ(xi))\mathcal{M} \leftarrow \mathcal{M} \cup \mathcal{P}_{s,p}(\phi(x_i))
    end for
    MC←∅\mathcal{M}_C \leftarrow \emptyset
    for i∈{0,…,l−1}i \in \{0, \dots, l - 1\} do
        if MC=∅\mathcal{M}_C = \emptyset then
            mi←m_i \leftarrow select an arbitrary element from M\mathcal{M}
        else
            mi←arg⁡max⁡m∈M∖MCmin⁡n∈MC∥ψ(m)−ψ(n)∥2m_i \leftarrow \arg\max_{m \in \mathcal{M} \setminus \mathcal{M}_C} \min_{n \in \mathcal{M}_C} \|\psi(m) - \psi(n)\|_2
        end if
        MC←MC∪{mi}\mathcal{M}_C \leftarrow \mathcal{M}_C \cup \{m_i\}
    end for
    return MC\mathcal{M}_C
  3. Knowl 3 — PatchCore Anomaly Scoring and Pixel-Level Localization

    model/method

    Given a test image xtestx^{\text{test}} and its patch collection P(xtest)=Ps,p(ϕ(xtest))\mathcal{P}(x^{\text{test}}) = \mathcal{P}_{s,p}(\phi(x^{\text{test}})), the base image-level anomaly candidate distance s∗s^* and the corresponding patch pair (mtest,∗,m∗)(m^{\text{test},*}, m^*) are found by identifying the test patch with the maximum Euclidean distance to its nearest neighbor in the coreset memory bank M\mathcal{M}:

    mtest,∗,m∗=arg⁡max⁡mtest∈P(xtest)min⁡m∈M∥mtest−m∥2m^{\text{test},*}, m^* = \arg\max_{m^{\text{test}} \in \mathcal{P}(x^{\text{test}})} \min_{m \in \mathcal{M}} \|m^{\text{test}} - m\|_2

    s∗=∥mtest,∗−m∗∥2s^* = \|m^{\text{test},*} - m^*\|_2

    To account for local density variations in the nominal feature space, s∗s^* is re-weighted using the bb nearest patch features Nb(m∗)\mathcal{N}_b(m^*) of m∗m^* in M\mathcal{M}:

    s=(1−exp⁡(∥mtest,∗−m∗∥2)∑m∈Nb(m∗)exp⁡(∥mtest,∗−m∥2))⋅s∗s = \left( 1 - \frac{\exp\left(\|m^{\text{test},*} - m^*\|_2\right)}{\sum_{m \in \mathcal{N}_b(m^*)} \exp\left(\|m^{\text{test},*} - m\|_2\right)} \right) \cdot s^*

    This re-weighting scales up the anomaly score if the nominal feature m∗m^* is itself in a sparse neighborhood of the memory bank.

    Pixel-level anomaly segmentation maps are constructed by:

    1. Assigning each test patch at location (h,w)(h, w) its distance min⁡m∈M∥ϕtest(h,w)−m∥2\min_{m \in \mathcal{M}} \|\phi^{\text{test}}(h, w) - m\|_2.
    2. Realigning these patch anomaly scores to their corresponding 2D spatial positions.
    3. Upscaling the 2D map to the original image resolution via bilinear interpolation.
    4. Applying Gaussian smoothing with kernel bandwidth σ=4\sigma = 4.
  4. Knowl 4 — Anomaly Detection and Segmentation Performance on MVTec AD

    data/table

    PatchCore was evaluated on the 15 categories of the MVTec Anomaly Detection (MVTec AD) benchmark. Images were resized and center-cropped to 224×224224 \times 224. PatchCore with a WideResNet-50 backbone was tested across different coreset subsampling ratios (25%, 10%, and 1%) and compared to prior methods.

    Method Image AUROC (%) ↑\uparrow Pixelwise AUROC (%) ↑\uparrow PRO (%) ↑\uparrow
    AE-SSIM - 87.0 69.4
    Uninformed Students - - 85.7
    SPADE 85.5 96.0 91.7
    Patch SVDD 92.1 95.7 -
    DifferNet 94.9 - -
    PaDiM 95.3 97.5 92.1
    MahalanobisAD 95.8 - -
    PaDiM* (tuned backbone) 97.9 - -
    PatchCore-25% 99.1 98.1 93.4
    PatchCore-10% 99.0 98.1 93.5
    PatchCore-1% 99.0 98.0 93.1

    PatchCore-25% achieves 99.1% image-level AUROC, reducing the detection error of the previous best method (PaDiM* at 97.9% AUROC, 2.1% error) to 0.9%, which corresponds to a 57% error reduction. At the F1-optimal decision threshold, PatchCore-25% misclassifies 42 out of 1725 test images on MVTec AD and solves 5 of the 15 categories perfectly. Subsampling the memory bank to 1% (a 100-fold compression) achieves 99.0% image AUROC and 98.0% pixel AUROC.

  5. Knowl 5 — Inference Latency Comparison on MVTec AD

    data/table

    Inference runtimes for joint image-level anomaly detection and pixel-level anomaly segmentation were measured per image on MVTec AD using a WideResNet-50 backbone on an Nvidia Tesla V4 GPU (including the network forward pass).

    Method Image AUROC (%) Pixel AUROC (%) PRO (%) Inference Time (s) ↓\downarrow
    SPADE 85.3 96.6 91.5 0.66
    PaDiM 95.4 97.3 91.8 0.19
    PatchCore-100% (no subsampling) 99.1 98.0 93.3 0.60
    PatchCore-100% + IVFPQ 98.0 97.9 93.0 0.20
    PatchCore-10% 99.0 98.1 93.5 0.22
    PatchCore-1% 99.0 98.0 93.1 0.17

    Without subsampling, PatchCore-100% executes faster than SPADE (0.60s vs 0.66s) while achieving higher detection accuracy. With coreset reduction to 1%, PatchCore-1% achieves 0.17s per image, outperforming PaDiM (0.19s) in both speed and accuracy (99.0% vs 95.4% image AUROC). Applying inverted file product quantization (IVFPQ) approximate nearest neighbor search to PatchCore-100% reduces runtime to 0.20s but degrades image AUROC from 99.1% to 98.0%.

  6. Knowl 6 — Low-Shot Industrial Anomaly Detection Performance

    data/table

    PatchCore was evaluated in limited nominal training sample regimes (from 1 to 50 shots per category, representing 0.4% to 21% of the full MVTec AD nominal training set), using a WideResNet-50 backbone.

    Metric / Method 1 shot (0.4%) 2 shots (0.8%) 5 shots (2.1%) 10 shots (4.1%) 16 shots (6.6%) 20 shots (8.3%) 50 shots (21%)
    Image AUROC (%)
    SPADE 71.6±0.771.6 \pm 0.7 73.4±1.373.4 \pm 1.3 75.2±1.575.2 \pm 1.5 77.5±1.177.5 \pm 1.1 78.9±0.978.9 \pm 0.9 79.6±0.879.6 \pm 0.8 81.1±0.481.1 \pm 0.4
    PaDiM 76.1±0.476.1 \pm 0.4 78.9±0.678.9 \pm 0.6 81.0±0.281.0 \pm 0.2 83.2±0.783.2 \pm 0.7 85.5±0.685.5 \pm 0.6 86.5±0.386.5 \pm 0.3 90.1±0.390.1 \pm 0.3
    DifferNet - - - - 87.3 - -
    PatchCore-10 83.4±0.683.4 \pm 0.6 86.4±0.986.4 \pm 0.9 90.8±0.890.8 \pm 0.8 93.6±0.693.6 \pm 0.6 95.4±0.795.4 \pm 0.7 95.8±0.695.8 \pm 0.6 97.5±0.397.5 \pm 0.3
    PatchCore-25 84.1±0.784.1 \pm 0.7 87.2±1.087.2 \pm 1.0 91.0±0.991.0 \pm 0.9 93.8±0.593.8 \pm 0.5 95.5±0.695.5 \pm 0.6 95.9±0.695.9 \pm 0.6 97.7±0.497.7 \pm 0.4
    Pixel AUROC (%)
    SPADE 91.9±0.391.9 \pm 0.3 93.1±0.293.1 \pm 0.2 94.5±0.194.5 \pm 0.1 95.4±0.195.4 \pm 0.1 95.7±0.295.7 \pm 0.2 95.7±0.295.7 \pm 0.2 96.2±0.096.2 \pm 0.0
    PaDiM 88.2±0.388.2 \pm 0.3 90.5±0.290.5 \pm 0.2 92.5±0.192.5 \pm 0.1 93.9±0.193.9 \pm 0.1 94.8±0.194.8 \pm 0.1 95.1±0.195.1 \pm 0.1 96.3±0.096.3 \pm 0.0
    PatchCore-10 92.0±0.292.0 \pm 0.2 93.1±0.293.1 \pm 0.2 94.8±0.194.8 \pm 0.1 96.2±0.196.2 \pm 0.1 96.8±0.396.8 \pm 0.3 96.9±0.396.9 \pm 0.3 97.8±0.097.8 \pm 0.0
    PatchCore-25 92.4±0.392.4 \pm 0.3 93.3±0.293.3 \pm 0.2 94.8±0.194.8 \pm 0.1 96.1±0.196.1 \pm 0.1 96.8±0.396.8 \pm 0.3 96.9±0.396.9 \pm 0.3 97.7±0.097.7 \pm 0.0
    PRO (%)
    SPADE 83.5±0.483.5 \pm 0.4 85.8±0.185.8 \pm 0.1 88.3±0.288.3 \pm 0.2 89.6±0.189.6 \pm 0.1 90.1±0.290.1 \pm 0.2 90.1±0.390.1 \pm 0.3 90.8±0.190.8 \pm 0.1
    PaDiM 72.4±1.272.4 \pm 1.2 77.8±0.777.8 \pm 0.7 82.7±0.282.7 \pm 0.2 85.9±0.285.9 \pm 0.2 87.5±0.287.5 \pm 0.2 88.2±0.288.2 \pm 0.2 90.4±0.190.4 \pm 0.1
    PatchCore-10 82.4±0.382.4 \pm 0.3 85.1±0.385.1 \pm 0.3 88.7±0.288.7 \pm 0.2 90.9±0.190.9 \pm 0.1 91.8±0.291.8 \pm 0.2 92.0±0.292.0 \pm 0.2 93.0±0.193.0 \pm 0.1
    PatchCore-25 83.7±0.583.7 \pm 0.5 86.0±0.386.0 \pm 0.3 88.8±0.288.8 \pm 0.2 90.9±0.190.9 \pm 0.1 91.7±0.191.7 \pm 0.1 91.9±0.291.9 \pm 0.2 92.8±0.092.8 \pm 0.0

    With 50 nominal shots (21% of training data), PatchCore-10 achieves 97.5% image AUROC and 97.8% pixel AUROC, matching full-dataset performance of earlier baselines. In the 16-shot setting, PatchCore-10 (95.4% AUROC) outperforms DifferNet (87.3% AUROC).

  7. Knowl 7 — Anomaly Detection and Localization on MTD and mSTC Datasets

    empirical result

    PatchCore was evaluated on two additional benchmarks:

    1. Magnetic Tile Defects (MTD): An industrial dataset of 925 defect-free and 392 defective magnetic tile images with variable image dimensions and illumination levels. 20% of defect-free images are held out for testing with defective images, while 80% form the cold-start training set. PatchCore-10 achieves 97.9% image-level AUROC, matching or exceeding DifferNet (97.7%), 1-NN (80.0%), and GANomaly (76.6%). Because tile image sizes vary, methods requiring rigid spatial alignment (such as PaDiM) cannot be applied directly without modification.

    2. Mini ShanghaiTech Campus (mSTC): A non-industrial video anomaly detection benchmark subsampled to every fifth frame across 12 pedestrian surveillance scenes (resized to 256×256256 \times 256). Using deeper feature hierarchy levels 3 and 4 (matching ImageNet semantics), PatchCore-10 achieves 91.8% pixelwise AUROC, exceeding PaDiM (91.2%), SPADE (89.9%), and CAVGA-RuR_u (85.0%) without hyperparameter optimization.

  8. Knowl 8 — Effect of Feature Hierarchy, Neighborhood Size, and Feature Striding

    empirical result

    Ablation studies on MVTec AD using a WideResNet-50 backbone reveal specific optimal configurations for feature hierarchy, patch neighborhood aggregation, and spatial striding:

    • Neighborhood size pp: Varying the neighborhood size p∈{1,2,3,4,5,6,7}p \in \{1, 2, 3, 4, 5, 6, 7\} in the local aggregation function demonstrates that p=3p = 3 is optimal. Smaller sizes (p=1p=1) lack spatial context, whereas larger sizes (p≥5p \ge 5) over-smooth localized defect signals and degrade detection and PRO scores.
    • Hierarchy levels: Evaluating individual and combined network blocks (indexed 1, 2, 3 from WideResNet-50) indicates that level 2 alone attains strong performance, while combining intermediate levels 2+32 + 3 yields the highest AUROC and PRO. Adding level 1 features offers negligible gain due to lack of receptive field context, whereas level 4 features introduce inductive bias toward ImageNet classification tasks at the expense of industrial defect sensitivity.
    • Feature striding ss: Increasing feature map striding from s=1s=1 to s=2s=2 and s=3s=3 reduces memory bank size but lowers image AUROC from 99.0% to 97.6% and 96.8%, respectively, confirming the necessity of dense spatial extraction.
  9. Knowl 9 — Comparison of Memory Subsampling Methods and Redundancy Reduction

    empirical result

    PatchCore compared greedy minimax coreset selection against two alternative reduction methods across subsampling target percentages ptarget∈[10−3,1.0]p_{\text{target}} \in [10^{-3}, 1.0]:

    1. Random subsampling: Uniformly selects a subset of patch features from M\mathcal{M}.
    2. Learned basis proxies: Optimizes a set of proxies P={pi}i=1∣P∣⊂Rd\mathcal{P} = \{p_i\}_{i=1}^{|\mathcal{P}|} \subset \mathbb{R}^d (∣P∣=ptarget⋅∣M∣|\mathcal{P}| = p_{\text{target}} \cdot |\mathcal{M}|) to minimize a soft reconstruction loss:

    Lrec(mi)=∥mi−∑pk∈Pexp⁡(−∥mi−pk∥2)∑pj∈Pexp⁡(−∥mi−pj∥2)pk∥22\mathcal{L}_{\text{rec}}(m_i) = \left\| m_i - \sum_{p_k \in \mathcal{P}} \frac{\exp\left(-\|m_i - p_k\|_2\right)}{\sum_{p_j \in \mathcal{P}} \exp\left(-\|m_i - p_j\|_2\right)} p_k \right\|_2^2

    Greedy coreset subsampling consistently outperforms both random selection and learned proxy optimization across all compression ratios. In the 10% to 50% subsampling regime, greedy coreset selection matches or slightly exceeds the AUROC and PRO metrics of the full 100% memory bank.

    Furthermore, greedy coreset subsampling reduces memory bank redundancy. In the uncompressed memory bank (100%), fewer than 30% of stored patch features are matched as nearest neighbors by test samples. Subsampling to 1% via greedy coreset increases this active feature utilization rate to nearly 95%.

  10. Knowl 10 — Performance Scaling with Image Resolution and Model Ensembles

    empirical result

    Because coreset subsampling to 1% (extPatchCore−1% ext{PatchCore-}1\%) reduces memory and computational requirements by a factor of 100, it enables deployment on higher input image resolutions and large multi-backbone ensembles while maintaining inference latency below that of PatchCore-10%\text{PatchCore-}10\% at default resolution (224×224224 \times 224):

    • WideResNet-101 (Hierarchies 2+3, resolution 280×280280 \times 280): Achieves 99.4% image AUROC, 98.2% pixelwise AUROC, and 94.4% PRO.
    • WideResNet-101 (Hierarchies 1+2+3, resolution 280×280280 \times 280): Achieves 99.2% image AUROC, 98.4% pixelwise AUROC, and 95.0% PRO.
    • Three-Model Ensemble (DenseNet-201, ResNeXt-101, and WideResNet-101 at resolution 320×320320 \times 320): Achieves 99.6% image AUROC (error rate 0.4%), 98.2% pixelwise AUROC, and 94.9% PRO, reducing the image anomaly classification error by more than half relative to single-backbone PatchCore-1% at 224×224224 \times 224.

Coverage note — Detailed per-class breakdowns from supplementary tables S1-S4 and qualitative misclassification image breakdowns (Figures S1-S2) were omitted in favor of the aggregate benchmark tables and core quantitative findings.

References

  1. 1.Pankaj Agarwal, Sariel Har, Peled Kasturi, and R Varadarajan. Geometric approximation via coresets. Combinatorial and Computational Geometry, 52, 11 2004.
  2. 2.Samet Akcay, Amir Atapour-Abarghouei, and Toby P Breckon. Ganomaly: Semi-supervised anomaly detection via adversarial training. In Asian Conference on Computer Vision, pages 622–637. Springer, 2018.
  3. 3.Jerone Andrews, Thomas Tanay, Edward Morton, and Lewis Griffin. Transfer representation-learning for anomaly detection. 07 2016.
  4. 4.Liron Bergman, Niv Cohen, and Yedid Hoshen. Deep nearest neighbor anomaly detection. CoRR, abs/2002.10445, 2020.
  5. 5.Paul Bergmann, Michael Fauser, David Sattlegger, and Carsten Steger. Mvtec ad – a comprehensive real-world dataset for unsupervised anomaly detection. In Proceedings of the IEEE/CVF Conference on Computer Vision and Pattern Recognition (CVPR), June 2019.
  6. 6.Paul Bergmann, Michael Fauser, David Sattlegger, and Carsten Steger. Uninformed students: Student-teacher anomaly detection with discriminative latent embeddings. In Proceedings of the IEEE/CVF Conference on Computer Vision and Pattern Recognition (CVPR), June 2020.
  7. 7.Paul Bergmann, Sindy Löwe, Michael Fauser, David Sattlegger, and Carsten Steger. Improving unsupervised defect segmentation by applying structural similarity to autoencoders. Proceedings of the 14th International Joint Conference on Computer Vision, Imaging and Computer Graphics Theory and Applications, 2019.
  8. 8.Wieland Brendel and Matthias Bethge. Approximating CNNs with bag-of-local-features models works surprisingly well on imagenet. In International Conference on Learning Representations, 2019.
  9. 9.Kenneth L. Clarkson. Coresets, sparse greedy approximation, and the frank-wolfe algorithm. ACM Trans. Algorithms, 6(4), Sept. 2010.
  10. 10.Niv Cohen and Yedid Hoshen. Sub-image anomaly detection with deep pyramid correspondences. CoRR, abs/2005.02357, 2020.
  11. 11.Sanjoy Dasgupta and Anupam Gupta. An elementary proof of a theorem of johnson and lindenstrauss. Random Structures & Algorithms, 22(1):60–65, 2003.
  12. 12.Diana Davletshina, Valentyn Melnychuk, Viet Tran, Hitansh Singla, Max Berrendorf, Evgeniy Faerman, Michael Fromm, and Matthias Schubert. Unsupervised anomaly detection for x-ray images, 2020.
  13. 13.Lucas Deecke, Robert Vandermeulen, Lukas Ruff, Stephan Mandt, and Marius Kloft. Image anomaly detection with generative adversarial networks. In Michele Berlingerio, Francesco Bonchi, Thomas Gärtner, Neil Hurley, and Georgiana Ifrim, editors, Machine Learning and Knowledge Discovery in Databases, pages 3–17, Cham, 2019. Springer International Publishing.
  14. 14.Thomas Defard, Aleksandr Setkov, Angelique Loesch, and Romaric Audigier. Padim: A patch distribution modeling framework for anomaly detection and localization. In Alberto Del Bimbo, Rita Cucchiara, Stan Sclaroff, Giovanni Maria Farinella, Tao Mei, Marco Bertini, Hugo Jair Escalante, and Roberto Vezzani, editors, Pattern Recognition. ICPR International Workshops and Challenges, pages 475–489, Cham, 2021. Springer International Publishing.
  15. 15.David Dehaene, Oriel Frigo, Sébastien Combrexelle, and Pierre Eline. Iterative energy-based projection on a normal data manifold for anomaly localization. In International Conference on Learning Representations, 2020.
  16. 16.J. Deng, W. Dong, R. Socher, L. Li, Kai Li, and Li Fei-Fei. Imagenet: A large-scale hierarchical image database. In 2009 IEEE Conference on Computer Vision and Pattern Recognition, pages 248–255, 2009.
  17. 17.Laurent Dinh, Jascha Sohl-Dickstein, and Samy Bengio. Density estimation using real NVP. In 5th International Conference on Learning Representations, ICLR 2017, Toulon, France, April 24-26, 2017, Conference Track Proceedings. OpenReview.net, 2017.
  18. 18.Eleazar Eskin, Andrew Arnold, Michael Prerau, Leonid Portnoy, and Sal Stolfo. A Geometric Framework for Unsupervised Anomaly Detection, pages 77–101. Springer US, Boston, MA, 2002.
  19. 19.Dan Feldman, Matthew Faulkner, and Andreas Krause. Scalable training of mixture models via coresets. In J. Shawe-Taylor, R. Zemel, P. Bartlett, F. Pereira, and K. Q. Weinberger, editors, Advances in Neural Information Processing Systems, volume 24, pages 2142–2150. Curran Associates, Inc., 2011.
  20. 20.Izhak Golan and Ran El-Yaniv. Deep anomaly detection using geometric transformations. In S. Bengio, H. Wallach, H. Larochelle, K. Grauman, N. Cesa-Bianchi, and R. Garnett, editors, Advances in Neural Information Processing Systems, volume 31, pages 9758–9769. Curran Associates, Inc., 2018.
  21. 21.Dong Gong, Lingqiao Liu, Vuong Le, Budhaditya Saha, Moussa Reda Mansour, Svetha Venkatesh, and Anton van den Hengel. Memorizing normality to detect anomaly: Memory-augmented deep autoencoder for unsupervised anomaly detection. In Proceedings of the IEEE/CVF International Conference on Computer Vision (ICCV), October 2019.
  22. 22.Sariel Har-Peled and Akash Kushal. Smaller coresets for k-median and k-means clustering. Discrete and Computational Geometry, 37:3–19, 12 2007.
  23. 23.Kaiming He, Xiangyu Zhang, Shaoqing Ren, and Jian Sun. Deep residual learning for image recognition. In Proceedings of the IEEE Conference on Computer Vision and Pattern Recognition (CVPR), June 2016.
  24. 24.Geoffrey Hinton, Oriol Vinyals, and Jeffrey Dean. Distilling the knowledge in a neural network. In NIPS Deep Learning and Representation Learning Workshop, 2015.
  25. 25.Chaoqing Huang, Jinkun Cao, Fei Ye, Maosen Li, Ya Zhang, and Cewu Lu. Inverse-transform autoencoder for anomaly detection. CoRR, abs/1911.10676, 2019.
  26. 26.Yibin Huang, C. Qiu, and K. Yuan. Surface defect saliency of magnetic tile. The Visual Computer, 36:85–96, 2018.
  27. 27.Jeff Johnson, Matthijs Douze, and Hervé Jégou. Billion-scale similarity search with gpus. IEEE Transactions on Big Data, pages 1–1, 2019.
  28. 28.Andrei Kapishnikov, Tolga Bolukbasi, Fernanda Viegas, and Michael Terry. Xrai: Better attributions through regions. In Proceedings of the IEEE/CVF International Conference on Computer Vision (ICCV), October 2019.
  29. 29.Ki Hyun Kim, Sangwoo Shim, Yongsub Lim, Jongseob Jeon, Jeongwoo Choi, Byungchan Kim, and Andre S. Yoon. Rapp: Novelty detection with reconstruction along projection pathway. In International Conference on Learning Representations, 2020.
  30. 30.Durk P Kingma and Prafulla Dhariwal. Glow: Generative flow with invertible 1x1 convolutions. In S. Bengio, H. Wallach, H. Larochelle, K. Grauman, N. Cesa-Bianchi, and R. Garnett, editors, Advances in Neural Information Processing Systems, volume 31. Curran Associates, Inc., 2018.
  31. 31.Wenqian Liu, Runze Li, Meng Zheng, Srikrishna Karanam, Ziyan Wu, Bir Bhanu, Richard J. Radke, and Octavia Camps. Towards visually explaining variational autoencoders. In Proceedings of the IEEE/CVF Conference on Computer Vision and Pattern Recognition (CVPR), June 2020.
  32. 32.W. Liu, D. Lian W. Luo, and S. Gao. Future frame prediction for anomaly detection – a new baseline. In 2018 IEEE Conference on Computer Vision and Pattern Recognition (CVPR), 2018.
  33. 33.Prasanta Chandra Mahalanobis. On the generalized distance in statistics. Proceedings of the National Institute of Sciences (Calcutta), 2:49–55, 1936.
  34. 34.Ben Mussay, Margarita Osadchy, Vladimir Braverman, Samson Zhou, and Dan Feldman. Data-independent neural pruning via coresets. In International Conference on Learning Representations, 2020.
  35. 35.Tiago S. Nazaré, Rodrigo Fernandes de Mello, and Moacir A. Ponti. Are pre-trained cnns good feature extractors for anomaly detection in surveillance videos? CoRR, abs/1811.08495, 2018.
  36. 36.Duc Tam Nguyen, Zhongyu Lou, Michael Klar, and Thomas Brox. Anomaly detection with multiple-hypotheses predictions. In Kamalika Chaudhuri and Ruslan Salakhutdinov, editors, Proceedings of the 36th International Conference on Machine Learning, volume 97 of Proceedings of Machine Learning Research, pages 4800–4809. PMLR, 09–15 Jun 2019.
  37. 37.Adam Paszke, Sam Gross, Francisco Massa, Adam Lerer, James Bradbury, Gregory Chanan, Trevor Killeen, Zeming Lin, Natalia Gimelshein, Luca Antiga, Alban Desmaison, Andreas Kopf, Edward Yang, Zach DeVito, Martin Raison, Alykhan Tejani, Sasank Chilamkurthy, Benoit Steiner, Lu Fang, Junjie Bai, and Soumith Chintala. Pytorch: An imperative style, high-performance deep learning library, 2019.
  38. 38.Pramuditha Perera, Ramesh Nallapati, and Bing Xiang. Ocgan: One-class novelty detection using gans with constrained latent representations. In Proceedings of the IEEE/CVF Conference on Computer Vision and Pattern Recognition (CVPR), June 2019.
  39. 39.Stanislav Pidhorskyi, Ranya Almohsen, Donald A. Adjeroh, and Gianfranco Doretto. Generative probabilistic novelty detection with adversarial autoencoders. In Proceedings of the 32nd International Conference on Neural Information Processing Systems, NIPS’18, page 6823–6834, Red Hook, NY, USA, 2018. Curran Associates Inc.
  40. 40.Oliver Rippel, Patrick Mertens, and Dorit Merhof. Modeling the distribution of normal data in pre-trained deep features for anomaly detection. In 2020 25th International Conference on Pattern Recognition (ICPR), pages 6726–6733, 2021.
  41. 41.Karsten Roth, Timo Milbich, Samarth Sinha, Prateek Gupta, Björn Ommer, and Joseph Paul Cohen. Revisiting training strategies and generalization performance in deep metric learning. In Hal Daumé III and Aarti Singh, editors, Proceedings of the 37th International Conference on Machine Learning, volume 119 of Proceedings of Machine Learning Research, pages 8242–8252. PMLR, 13–18 Jul 2020.
  42. 42.Marco Rudolph, Bastian Wandt, and Bodo Rosenhahn. Same same but differnet: Semi-supervised defect detection with normalizing flows. In Winter Conference on Applications of Computer Vision (WACV), Jan. 2021.
  43. 43.Mohammad Sabokrou, Mohammad Khalooei, Mahmood Fathy, and Ehsan Adeli. Adversarially learned one-class classifier for novelty detection. In Proceedings of the IEEE Conference on Computer Vision and Pattern Recognition (CVPR), June 2018.
  44. 44.Mayu Sakurada and Takehisa Yairi. Anomaly detection using autoencoders with nonlinear dimensionality reduction. In Proceedings of the MLSDA 2014 2nd Workshop on Machine Learning for Sensory Data Analysis, MLSDA’14, page 4–11, New York, NY, USA, 2014. Association for Computing Machinery.
  45. 45.Mohammadreza Salehi, Niousha Sadjadi, Soroosh Baselizadeh, Mohammad Hossein Rohban, and Hamid R. Rabiee. Multiresolution knowledge distillation for anomaly detection, 2020.
  46. 46.Bernhard Schölkopf, Robert C. Williamson, Alex J. Smola, John Shawe-Taylor, and John C. Platt. Support vector method for novelty detection. In Advances in Neural Information Processing Systems 12, pages 582–588, Cambridge, MA, USA, June 2000. Max-Planck-Gesellschaft, MIT Press.
  47. 47.R. R. Selvaraju, M. Cogswell, A. Das, R. Vedantam, D. Parikh, and D. Batra. Grad-cam: Visual explanations from deep networks via gradient-based localization. In 2017 IEEE International Conference on Computer Vision (ICCV), pages 618–626, 2017.
  48. 48.Ozan Sener and Silvio Savarese. Active learning for convolutional neural networks: A core-set approach. In International Conference on Learning Representations, 2018.
  49. 49.Samarth Sinha, Han Zhang, Anirudh Goyal, Yoshua Bengio, Hugo Larochelle, and Augustus Odena. Small-GAN: Speeding up GAN training using core-sets. In Hal Daumé III and Aarti Singh, editors, Proceedings of the 37th International Conference on Machine Learning, volume 119 of Proceedings of Machine Learning Research, pages 9005–9015. PMLR, 13–18 Jul 2020.
  50. 50.David M. J. Tax and Robert P. W. Duin. Support vector data description. Machine Learning, 54:45–66, 2004.
  51. 51.Guido Van Rossum and Fred L. Drake. Python 3 Reference Manual. CreateSpace, Scotts Valley, CA, 2009.
  52. 52.Shashanka Venkataramanan, Kuan-Chuan Peng, Rajat Vikram Singh, and Abhijit Mahalanobis. Attention guided anomaly localization in images. In Andrea Vedaldi, Horst Bischof, Thomas Brox, and Jan-Michael Frahm, editors, Computer Vision – ECCV 2020, pages 485–503, Cham, 2020. Springer International Publishing.
  53. 53.Ross Wightman. Pytorch image models. https : / / github . com / rwightman / pytorch - image - models, 2019.
  54. 54.Laurence A. Wolsey and George L. Nemhauser. Integer and Combinatorial Optimization. Wiley Series in Discrete Mathematics and Optimization. Wiley, 2014.
  55. 55.Saining Xie, Ross Girshick, Piotr Dollar, Zhuowen Tu, and Kaiming He. Aggregated residual transformations for deep neural networks. In Proceedings of the IEEE Conference on Computer Vision and Pattern Recognition (CVPR), July 2017.
  56. 56.Jihun Yi and Sungroh Yoon. Patch svdd: Patch-level svdd for anomaly detection and segmentation. In Proceedings of the Asian Conference on Computer Vision (ACCV), November 2020.
  57. 57.Sergey Zagoruyko and Nikos Komodakis. Wide residual networks. In Edwin R. Hancock Richard C. Wilson and William A. P. Smith, editors, Proceedings of the British Machine Vision Conference (BMVC), pages 87.1–87.12. BMVA Press, September 2016.
  58. 58.Shuangfei Zhai, Yu Cheng, Weining Lu, and Zhongfei Zhang. Deep structured energy based models for anomaly detection. In Maria Florina Balcan and Kilian Q. Weinberger, editors, Proceedings of The 33rd International Conference on Machine Learning, volume 48 of Proceedings of Machine Learning Research, pages 1100–1109, New York, New York, USA, 20–22 Jun 2016. PMLR.
  59. 59.Zhou Wang, A. C. Bovik, H. R. Sheikh, and E. P. Simoncelli. Image quality assessment: from error visibility to structural similarity. IEEE Transactions on Image Processing, 13(4):600–612, 2004.
  60. 60.Bo Zong, Qi Song, Martin Renqiang Min, Wei Cheng, Cristian Lumezanu, Daeki Cho, and Haifeng Chen. Deep autoencoding gaussian mixture model for unsupervised anomaly detection. In International Conference on Learning Representations, 2018.

Citation

MLA
Roth, K., et al. “Towards Total Recall in Industrial Anomaly Detection”. arXiv, 2021, http://arxiv.org/abs/2106.08265v2.
APA
Roth, K., Pemula, L., Zepeda, J., Schölkopf, B., Brox, T., & Gehler, P. (2021). Towards Total Recall in Industrial Anomaly Detection. arXiv. http://arxiv.org/abs/2106.08265v2
Chicago
Roth, K., L. Pemula, J. Zepeda, B. Schölkopf, T. Brox, and P. Gehler. 2021. “Towards Total Recall in Industrial Anomaly Detection”. arXiv. http://arxiv.org/abs/2106.08265v2.
Harvard
Roth, K. et al. (2021) “Towards Total Recall in Industrial Anomaly Detection”, arXiv [Preprint]. Available at: http://arxiv.org/abs/2106.08265v2.
Vancouver
1. Roth K, Pemula L, Zepeda J, Schölkopf B, Brox T, Gehler P (2021) Towards Total Recall in Industrial Anomaly Detection. arXiv

BibTeX

@article{roth2021towards,
  title = {Towards Total Recall in Industrial Anomaly Detection},
  author = {Roth, Karsten and Pemula, Latha and Zepeda, Joaquin and Schölkopf, Bernhard and Brox, Thomas and Gehler, Peter},
  year = {2021},
  journal = {arXiv},
  url = {http://arxiv.org/abs/2106.08265v2},
  eprint = {2106.08265}
}
Metadata:arXiv

Source Code

This paper has an official code repository available. Click below to access the source code.

View Repository

Access the Paper

This paper is available from its original source. Click below to access the PDF.

Open PDF

License: IEEE