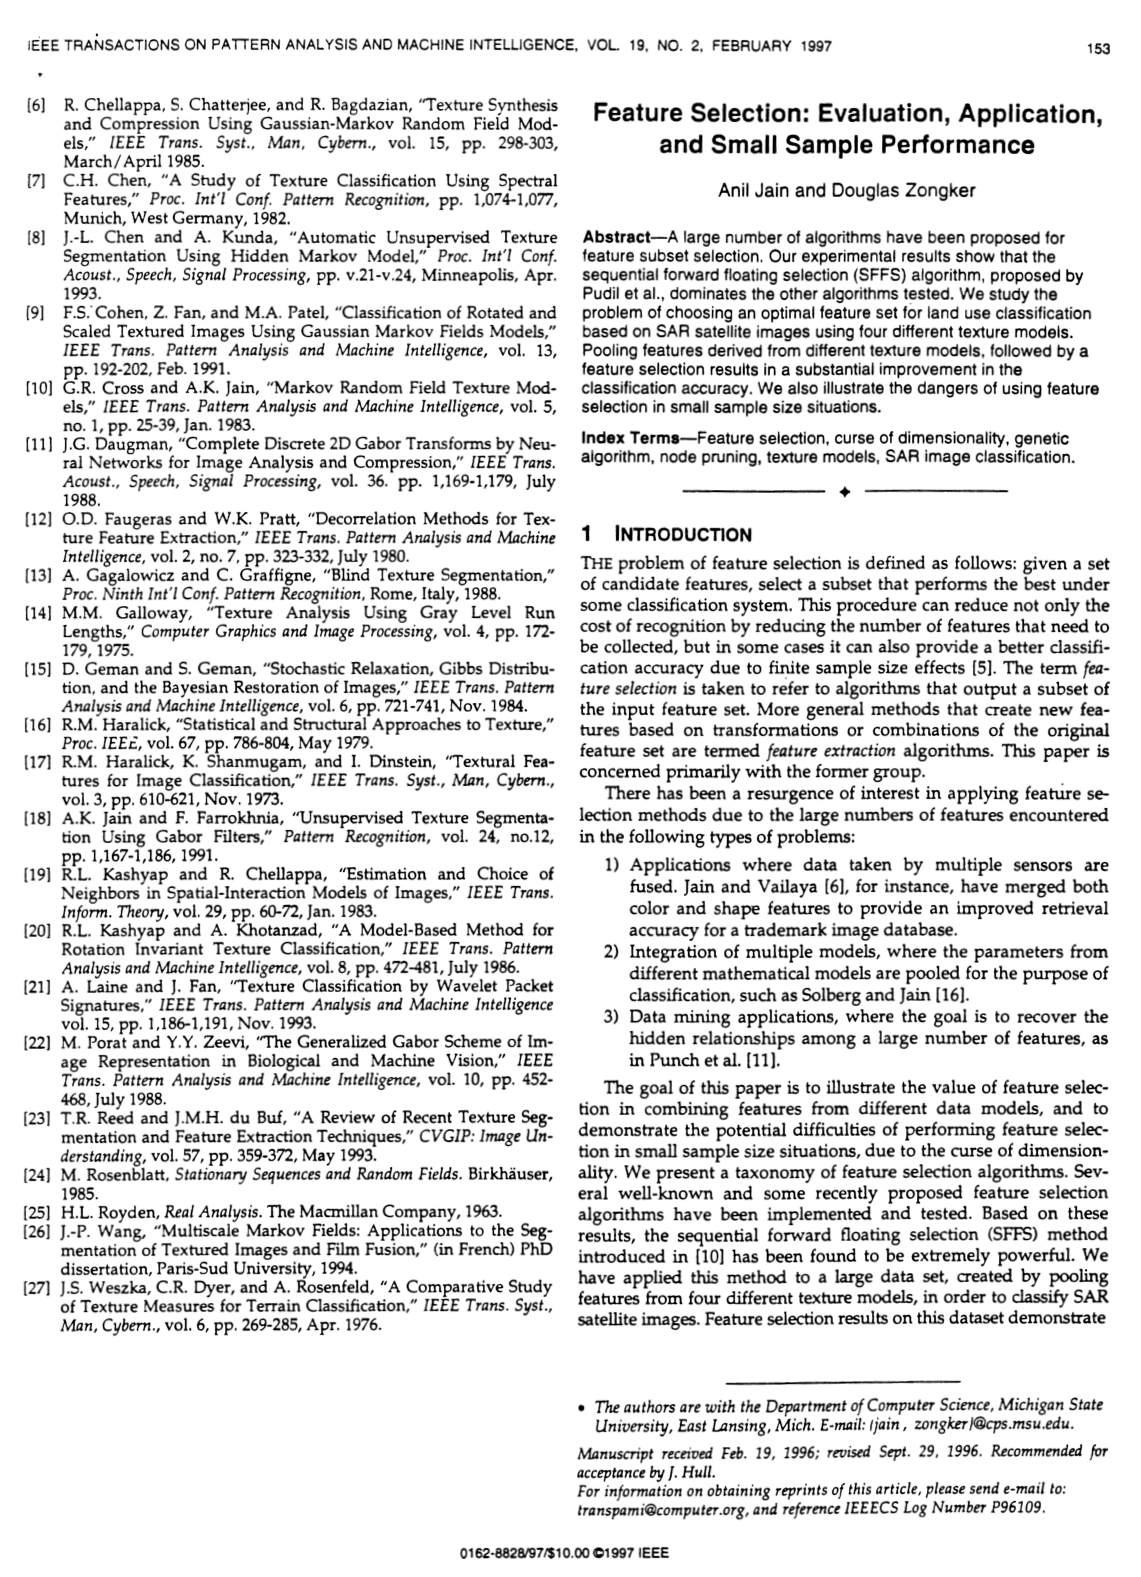
Feature Selection: Evaluation, Application, and Small Sample Performance

Anil K. JainDouglas E. Zongker

article1997TPAMI2,396 citations

Compares prominent feature subset selection methods on synthetic benchmarks and SAR satellite imagery, establishing the superior performance of sequential forward floating selection while identifying critical pitfalls of selection algorithms in small-sample scenarios.

Listen

Modern pattern recognition and data mining systems often gather hundreds of measurements across multiple sources or mathematical representations. While capturing more dimensions can theoretically improve system performance, including too many irrelevant or redundant inputs increases processing costs and can paradoxically degrade classification accuracy. Consequently, selecting an optimal subset of informative variables is critical for building efficient, high-performing automated decision systems.

The article evaluates the practical performance of fifteen major variable selection techniques across synthetic and real-world datasets. It specifically assesses how these algorithms balance computational effort and accuracy, how multi-model information can be combined effectively, and how limited training sample sizes impact the reliability of subset selection.

To conduct this evaluation, the researchers tested a range of statistical and neural-network-based selection techniques using controlled synthetic distributions as well as a real-world satellite terrain classification dataset comprising eighteen texture features from four different mathematical models. Controlled simulations were also run with varying training sample sizes, ranging from very small to large datasets, to measure how accurately selection routines recover known optimal subsets.

The primary finding is that the sequential forward floating selection method consistently delivers near-optimal accuracy while remaining computationally efficient, clearly outperforming standard forward, backward, and genetic search algorithms on complex tasks. Second, combining measurements from diverse mathematical models and applying subset selection substantially boosted satellite image classification accuracy from a baseline of under seventy percent up to approximately eighty-nine percent. Third, the results demonstrate that small training sample sizes severely degrade selection quality, causing algorithms to pick suboptimal variable subsets due to estimation errors in high-dimensional spaces.

These findings indicate that integrating multiple complementary data representations combined with robust subset selection provides a practical pathway to superior operational accuracy. However, practitioners must recognize the high risk of over-fitting and poor generalization when variable selection is attempted on small training sets, as the apparent performance gains during training may fail to hold up on new data.

Organizations developing automated classification systems should adopt floating selection algorithms as a reliable standard for moderate-to-high dimensional problems. Teams should also ensure that sample sizes are sufficiently large relative to the number of measured variables before performing selection, or otherwise acquire additional ground-truth data prior to deploying critical classification systems.

The primary limitations of this study include its reliance on synthetic Gaussian distributions for mathematical validation and an empirical focus on a single satellite imagery application. While the comparative rankings among search methods are highly robust, performance trade-offs may vary depending on the specific classifier architecture and underlying data distributions encountered in other operational contexts.

Cover for Feature Selection: Evaluation, Application, and Small Sample Performance

Abstract

A large number of algorithms have been proposed for feature subset selection. Our experimental results show that the sequential forward floating selection (SFFS) algorithm, proposed by Pudil et al., dominates the other algorithms tested. We study the problem of choosing an optimal feature set for land use classification based on SAR satellite images using four different texture models. Pooling features derived from different texture models, followed by a feature selection results in a substantial improvement in the classification accuracy. We also illustrate the dangers of using feature selection in small sample size situations.

Table of Contents

  • 1 INTRODUCTION
  • 2 FEATURE SELECTION ALGORITHMS
  • 2.1 Deterministic, Single-Solution Methods
  • 2.2 Deterministic, Multiple-Solution Methods
  • 2.3 Stochastic, Multiple-Solution Methods
  • 2.4 Optimal Methods
  • 2.5 Node Pruning
  • 3 EXPERIMENTAL RESULTS
  • 4 SELECTION OF TEXTURE FEATURES
  • 5 EFFECT OF TRAINING SET SIZE ON FEATURE SELECTION
  • 6 SUMMARY
  • REFERENCES
  • 1 INTRODUCTION

Knowls

  1. Knowl 1 — Taxonomy of Feature Selection Algorithms

    model/method

    Feature selection algorithms are categorized into two primary paradigms: statistical pattern recognition (SPR) methods and artificial neural network (ANN) node pruning.

    Within the SPR framework, methods are divided into:

    1. Optimal methods: Guarantee discovery of the subset maximizing the criterion function under monotonicity conditions. These include exhaustive search (evaluating all (nd)\binom{n}{d} combinations) and branch-and-bound (BB) search.
    2. Suboptimal methods: Heuristic approaches that do not guarantee optimality, further partitioned into:
      • Single-solution (sequential) methods: Maintain a single candidate subset and iteratively add or delete features. These include deterministic techniques—such as Sequential Forward Selection (SFS), Sequential Backward Selection (SBS), Generalized SFS/SBS (GSFS/GSBS), Plus-ll-Take-Away-rr (PTA(l,rl, r)), Sequential Forward Floating Selection (SFFS), Sequential Backward Floating Selection (SFBS), and Max-Min (MM)—as well as stochastic techniques such as Simulated Annealing (SA).
      • Multiple-solution methods: Maintain a population of candidate feature subsets. These encompass deterministic graph-search methods (such as beam search) and stochastic methods (such as Genetic Algorithms (GA)).

    In the ANN paradigm, input node pruning (NP) trains a multilayer feedforward network, computes the saliency of each input node, removes the least salient node, and retrains the network iteratively.

  2. Knowl 2 — Mathematical Formulation of the Feature Selection Problem

    definition

    Let Y={y1,y2,…,yn}Y = \{y_1, y_2, \dots, y_n\} denote a set of nn candidate features. The objective of feature selection is to find a feature subset X⊆YX \subseteq Y with a specified cardinality ∣X∣=d|X| = d (d<nd < n) that optimizes a chosen criterion function J(X)J(X):

    X∗=arg⁡max⁡X⊆Y∣X∣=dJ(X)X^* = \arg\max_{\substack{X \subseteq Y \\ |X| = d}} J(X)

    The criterion function J(X)J(X) assesses the discriminative capability of subset XX. A standard criterion is J(X)=1−pe(X)J(X) = 1 - p_e(X), where pe(X)p_e(X) is the classification error probability of a designated classifier trained on features XX. When class-conditional densities are Gaussian with mean vectors μ1,μ2\mu_1, \mu_2 and common covariance matrix Σ\Sigma, a common parametric criterion is the Mahalanobis distance between the two class means:

    J(X)=(μ1(X)−μ2(X))TΣ(X)−1(μ1(X)−μ2(X))J(X) = (\mu_1(X) - \mu_2(X))^T \Sigma(X)^{-1} (\mu_1(X) - \mu_2(X))

    where μi(X)\mu_i(X) and Σ(X)\Sigma(X) are the mean vectors and covariance matrix restricted to the feature subset XX.

  3. Knowl 3 — Multi-Model Texture Feature Pooling and SFFS Selection for SAR Image Classification

    empirical result

    Classifying 22,000 synthetic aperture radar (SAR) satellite image pixels into five land-use categories (Water, Urban areas, Forest, Agricultural, Other areas) demonstrates the effectiveness of pooling features across distinct texture models combined with Sequential Forward Floating Selection (SFFS).

    A total of 18 features per pixel were extracted from four texture model families:

    1. Local statistics (6 features: mean, variance, power-to-mean ratio, skewness, kurtosis, contrast)
    2. Log-normal Markov Random Field / MAR (5 features: parameters θ1,θ2,θ3\theta_1, \theta_2, \theta_3, noise variance σ\sigma, logarithmic mean)
    3. Gray Level Co-occurrence Matrices / GLCM (6 features: angular second moment, contrast, inverse difference moment, entropy, inertia, cluster shade)
    4. Fractal models (2 features: lacunarity, fractal dimension)

    Classification using kk-nearest neighbor (kkNN) on independent training and test sets yielded the following results:

    Classifier Best Recognition Rate (%) Optimal Number of Features
    1NN 89.3 12
    3NN 88.4 11

    The best single texture model alone (MAR) achieved only 68.8% accuracy with 1NN. Combining pooled features with SFFS boosted accuracy to 89.3%. Furthermore, every optimal subset of size 5 or greater selected by SFFS contained features from at least three different texture models.

  4. Knowl 4 — Comparative Evaluation of Feature Selection Algorithms on Synthetic Gaussian Data

    empirical result

    An empirical comparison of 15 feature selection algorithms was conducted on a 20-dimensional, two-class synthetic Gaussian dataset engineered to induce feature nesting problems (where optimal subsets of size dd do not necessarily contain the optimal subsets of size d−1d-1). The criterion was the estimated Mahalanobis distance, averaged over 10 independent datasets of 1,000 samples per class.

    The key empirical findings are:

    • Sequential Forward Floating Selection (SFFS) achieves criterion values nearly identical to the optimal Branch-and-Bound (BB) algorithm across almost all subset sizes dd, while requiring substantially less computation time than BB for moderate to large dd.
    • Sequential Forward Selection (SFS) and Sequential Backward Selection (SBS) suffer from nesting traps, yielding lower criterion values than floating and branch-and-bound methods. SFS is significantly faster than SBS because evaluating criterion functions on small subsets requires inverting smaller matrices than on large subsets.
    • Max-Min (MM) is the fastest algorithm tested, but its criterion performance deteriorates sharply as subset size dd increases, because its initial advantage from choosing the best feature pair diminishes.
    • Generalized SFS/SBS (GSFS/GSBS) and Plus-ll-Take-Away-rr (PTA) outperform standard SFS/SBS but require significantly more computation time due to exploring multiple feature additions/deletions.
  5. Knowl 5 — Trunk's Gaussian Distribution Benchmark for Finite-Sample Feature Selection

    experimental setup

    Trunk's two-class Gaussian distribution model provides an analytical benchmark where the true underlying optimal feature subset of any size dd is known a priori.

    The two nn-dimensional class-conditional probability density functions are defined by:

    p(x∣ω1)∼N(μ,In),p(x∣ω2)∼N(−μ,In)p(x \mid \omega_1) \sim \mathcal{N}(\mu, I_n), \quad p(x \mid \omega_2) \sim \mathcal{N}(-\mu, I_n)

    where InI_n is the n×nn \times n identity covariance matrix, and the mean vector μ∈Rn\mu \in \mathbb{R}^n has components:

    μ=[11,12,13,…,1n]T\mu = \left[ \frac{1}{\sqrt{1}}, \frac{1}{\sqrt{2}}, \frac{1}{\sqrt{3}}, \dots, \frac{1}{\sqrt{n}} \right]^T

    Properties of this benchmark:

    • Because the covariance matrix is InI_n, all features are statistically independent with unit variance.
    • Feature ii provides discriminative power proportional to 1/i1/\sqrt{i}, strictly decreasing with index ii.
    • For any subset size d≤nd \le n, the unique true optimal subset consists of the first dd features: {1,2,…,d}\{1, 2, \dots, d\}.
    • When the true mean vector μ\mu is known, the true Bayes error pe(n)p_e(n) monotonically decreases toward 0 as n→∞n \to \infty. However, when μ\mu is estimated from a finite sample of size NN, the estimated error probability p^e(n)\hat{p}_e(n) exhibits peaking: lim⁡n→∞p^e(n)=1/2\lim_{n \to \infty} \hat{p}_e(n) = 1/2.
  6. Knowl 6 — Feature Subset Quality Metric for Benchmarking Against Known Ground Truth

    definition

    When evaluating a feature selection algorithm on a distribution where the true optimal feature subset Xd∗⊂{1,2,…,n}X_d^* \subset \{1, 2, \dots, n\} of size dd is known, the quality Q(Xd)Q(X_d) of an experimentally selected subset XdX_d is measured by the proportion of correct feature inclusion and exclusion decisions:

    Q(Xd)=∣Xd∩Xd∗∣+∣(Y∖Xd)∩(Y∖Xd∗)∣nQ(X_d) = \frac{|X_d \cap X_d^*| + |(Y \setminus X_d) \cap (Y \setminus X_d^*)|}{n}

    where YY is the full set of nn candidate features.

    To assess overall algorithm performance across all subset sizes from d=1d = 1 to n−1n-1, the average subset quality Qˉ\bar{Q} is computed as:

    Qˉ=1n−1∑d=1n−1Q(Xd)\bar{Q} = \frac{1}{n-1} \sum_{d=1}^{n-1} Q(X_d)

    A value of Qˉ=1.0\bar{Q} = 1.0 indicates that the feature selection algorithm successfully identified the exact true optimal subset for every subset size dd.

  7. Knowl 7 — Degradation of Feature Selection Quality under Small Sample Sizes

    empirical result

    Using Trunk's 20-dimensional independent Gaussian distribution—where the true optimal subset of size dd is {1,2,…,d}\{1, 2, \dots, d\}—feature selection algorithms (Branch-and-Bound and SFS) were evaluated across training set sizes ranging from 10 to 5,000 patterns per class (averaged over 5 independent runs per sample size).

    Key observations:

    • Small sample degradation: With 10 patterns per class, the average subset quality Qˉ\bar{Q} was approximately 0.67 for both Branch-and-Bound and SFS. Even though Branch-and-Bound guarantees mathematical optimality with respect to the sample-estimated criterion, estimation errors in the sample mean and covariance cause it to select heavily corrupted feature subsets relative to the true underlying distribution.
    • Example subset corruption: For a target size of d=10d=10 (true optimal subset {1,2,3,4,5,6,7,8,9,10}\{1, 2, 3, 4, 5, 6, 7, 8, 9, 10\}), Branch-and-Bound with 20 training patterns per class selected the subset {1,2,4,7,9,12,13,14,15,18}\{1, 2, 4, 7, 9, 12, 13, 14, 15, 18\}, erroneously selecting 5 suboptimal features.
    • Asymptotic recovery: As training sample size increased to 2,500 patterns per class, the selected 10-feature subset improved to {1,2,3,4,5,6,7,9,10,11}\{1, 2, 3, 4, 5, 6, 7, 9, 10, 11\} (9 out of 10 correct), with average quality Qˉ\bar{Q} approaching ~0.95, reaching ~0.97 at 5,000 patterns per class.
    • Algorithm convergence: Because features in Trunk's model are independent, Branch-and-Bound and SFS achieved virtually identical average subset quality curves across all sample sizes.
  8. Knowl 8 — Peaking Phenomenon in Classification Accuracy Over Feature Subset Size

    empirical result

    In multi-class SAR image pixel classification using 1NN and 3NN classifiers with subsets chosen by SFFS from 18 pooled texture features, classification accuracy exhibits a peaking phenomenon (the curse of dimensionality).

    As the feature subset size dd increases from 1 to 18:

    • Recognition rate begins below 65% for d=1d=1.
    • It rises steadily as informative features are added, reaching a maximum of 89.3% at d=12d=12 for the 1NN classifier (and 88.4% at d=11d=11 for the 3NN classifier).
    • Beyond the optimal subset size (d>12d > 12), recognition accuracy systematically declines as additional, redundant, or noisy features are included, dropping to approximately 72% when all 18 features are used.

    This demonstrates that pooling large numbers of candidate features from multiple models is only beneficial when coupled with effective feature subset selection.

  9. Knowl 9 — Operational Challenges and Premature Convergence of Genetic Algorithms in Feature Selection

    limitation

    When applied to feature selection—where a chromosome is a binary string of length nn representing the presence or absence of each feature—Genetic Algorithms (GAs) exhibit several practical difficulties:

    • Hyperparameter sensitivity: Algorithm performance depends heavily on the feasibility threshold tt, tolerance margin mm, population size, and mutation probability pmp_m, with no standardized principles for selecting these hyperparameters.
    • Subset size bias in fitness evaluation: Unlike sequential selection methods that target a fixed subset size dd, a standard GA chromosome represents subsets of arbitrary sizes. Evaluating chromosome fitness directly via classification accuracy biases the search toward larger subsets that may appear to perform better on training data due to overfitting.
    • Premature convergence: On a 20-dimensional synthetic Gaussian classification task (with population size 100, 15 generations, pm=0.02p_m = 0.02, t=0.1t = 0.1, m=0.05m = 0.05), GA runs consistently peaked in fitness around generation 7 or 8 and failed to make further progress, reaching a best recognition rate of only 78.9% for an 8-element subset compared to >85% achieved by deterministic floating methods.
  10. Knowl 10 — Saliency-Based Neural Network Node Pruning for Feature Selection

    model/method

    The node-pruning (NP) method integrates feature selection with classifier training using a multilayer feedforward neural network trained via backpropagation.

    For an input or hidden node ii, the saliency measure SiS_i quantifies the approximate increase in the squared-error cost function across all training patterns resulting from the removal of that node:

    Si=∑k(∂E∂wkiwki+12∂2E∂wki2wki2)S_i = \sum_{k} \left(\frac{\partial E}{\partial w_{ki}} w_{ki} + \frac{1}{2} \frac{\partial^2 E}{\partial w_{ki}^2} w_{ki}^2\right)

    where EE is the network squared error and wkiw_{ki} represents the weight connecting node ii to node kk. Using backpropagation derivatives, saliency is evaluated efficiently in a single forward-backward pass per pattern rather than requiring full retraining for every candidate node removal.

    The feature selection procedure operates as follows:

    1. Train the feedforward network on the current set of features using backpropagation until convergence.
    2. Compute the saliency of each node using backpropagation derivatives.
    3. Remove the input node with the lowest saliency (which corresponds to discarding that feature).
    4. Retrain the reduced network.
    5. Repeat steps 2–4 until the desired trade-off between subset size and classification error is attained.

Coverage note — No substantial contributed material was omitted; the unrelated paper starting on page 6 was excluded.

References

  1. 1.T.M. Cover and J.M. Van Campenhout, "On the Possible Orderings in the Measurement Selection Problem," IEEE Trans. Systems, Man, and Cybernetics, vol. 7, no. 9, pp. 657-661, Sept. 1977.
  2. 2.R.O. Duda and P.E. Hart, Pattern Classification and Scene Analysis. Wiley, 1973.
  3. 3.F. Ferri, P. Pudil, M. Hatef, and J. Kittler, "Comparative Study of Techniques for Large Scale Feature Selection," Pattern Recognition in Practice IV, E. Gelsema and L. Kanal, eds., pp. 403-413. Elsevier Science B.V., 1994.
  4. 4.Y. Hamamoto, S. Uchimura, Y. Matsunra, T. Kanaoka, and S. Tomita, "Evaluation of the Branch and Bound Algorithm for Feature Selection," Pattern Recognition Letters, vol. 11, pp. 453-456, July 1990.
  5. 5.A.K. Jain and B. Chandrasekaran, "Dimensionality and Sample Size Considerations," Pattern Recognition in Practice, P.R. Krishnaiah and L.N. Kanal, eds., vol. 2, chap 39, pp. 835-855. North-Holland, 1982.
  6. 6.A.K. Jain and A. Vailaya, "Image Retrieval Using Color and Shape," Pattern Recognition, vol. 29, no. 8, pp. 1,233-1,244, Aug. 1996.
  7. 7.J. Kittler, "Feature Set Search Algorithms," Pattern Recognition and Signal Processing, C.H. Chen, ed., pp. 41-60. Sijthoff and Noordhoff, Alphen aan den Rijn, The Netherlands, 1978.
  8. 8.J. Mao, K. Mohiuddin, and A.K. Jain, "Parsimonious Network Design and Feature Selection Through Node Pruning," Proc. 12th ICPR, Jerusalem, pp. 622-624, 1994.
  9. 9.P.M. Narendra and K. Fukunaga, "A Branch and Bound Algorithm for Feature Subset Selection," IEEE Trans. Computers, vol. 26, no. 9, pp. 917-922, Sept. 1977.
  10. 10.P. Pudil, J. Novovicova, and J. Kittler, "Floating Search Methods in Feature Selection," Pattern Recognition Letters, vol. 15, pp. 1,119-1,125, Nov. 1994.
  11. 11.W.F. Punch, E.D. Goodman, M. Pei, L. Chia-Shun, P. Hovland, and R. Enbody, "Further Research on Feature Selection and Classification Using Genetic Algorithms," Proc. Fifth Int'l Conf. Genetic Algorithms, pp. 557-564, 1993.
  12. 12.S.J. Raudys and A.K. Jain, "Small Sample Size Effects in Statistical Pattern Recognition: Recommendations for Practitioners," IEEE Trans. Pattern Analysis and Machine Intelligence, vol. 13, pp. 252-264, March 1991.
  13. 13.D.E. Rumelhart, G.E. Hinton, and R.J. Williams, "Learning Internal Representations by Error Propagation," Parallel Distributed Processing: Explorations in the Microstructure of Cognition, D.E. Rumelhart and J.L. McClelland, eds., vol. 1, chap. 8, pp. 318-362. MIT Press, 1986.
  14. 14.W. Siedlecki and J. Sklansky, "On Automatic Feature Selection," Int'l J. Pattern Recognition and Artificial Intelligence, vol. 2, no. 2, pp. 197-220, 1988.
  15. 15.W. Siedlecki and J. Sklansky, "A Note on Genetic Algorithms for Large-Scale Feature Selection," Pattern Recognition Letters, vol. 10, no. 335-347, Nov. 1989.
  16. 16.A.H.S. Solberg and A.K. Jain, "A Study of the Invariance Properties of Textural Features," Proc. IGARS Conf., pp. 670-672, Florence, Italy, July 1995.
  17. 17.G.V. Trunk, "A Problem of Dimensionality: A Simple Example," IEEE Trans. Pattern Analysis and Machine Intelligence, vol. 1, no. 3, no. 306-307, July 1979.
  18. 18.Z. You and A.K. Jain, "Performance Evaluation of Shape Matching via Chord Length Distribution," Computer Vision, Graphics and Image Processing, vol. 28, pp. 185-198, 1984.
  19. 19.B. Yu and B. Yuan, "A More Efficient Branch and Bound Algorithm for Feature Selection," Pattern Recognition, vol. 26, no. 6, pp. 883-889, 1993.

Citation

MLA
Jain, A., and D. Zongker. “Feature Selection: Evaluation, Application, and Small Sample Performance”. IEEE Transactions on Pattern Analysis and Machine Intelligence, vol. 19, no. 2, 1997, pp. 153–58, https://doi.org/10.1109/34.574797.
APA
Jain, A., & Zongker, D. (1997). Feature selection: evaluation, application, and small sample performance. IEEE Transactions on Pattern Analysis and Machine Intelligence, 19(2), 153–158. https://doi.org/10.1109/34.574797
Chicago
Jain, A., and D. Zongker. 1997. “Feature Selection: Evaluation, Application, and Small Sample Performance”. IEEE Transactions on Pattern Analysis and Machine Intelligence 19 (2): 153–58. https://doi.org/10.1109/34.574797.
Harvard
Jain, A. and Zongker, D. (1997) “Feature selection: evaluation, application, and small sample performance”, IEEE Transactions on Pattern Analysis and Machine Intelligence, 19(2), pp. 153–158. Available at: https://doi.org/10.1109/34.574797.
Vancouver
1. Jain A, Zongker D (1997) Feature selection: evaluation, application, and small sample performance. IEEE Transactions on Pattern Analysis and Machine Intelligence 19:153–158

BibTeX

@article{Jain_1997, title={Feature selection: evaluation, application, and small sample performance}, volume={19}, ISSN={0162-8828}, url={http://dx.doi.org/10.1109/34.574797}, DOI={10.1109/34.574797}, number={2}, journal={IEEE Transactions on Pattern Analysis and Machine Intelligence}, publisher={Institute of Electrical and Electronics Engineers (IEEE)}, author={Jain, A. and Zongker, D.}, year={1997}, pages={153–158} }
Metadata:Crossref

Access the Paper

This paper is available from its original source. Click below to access the PDF.

Open PDF