Automating the design of graphical presentations of relational information

Jock D. Mackinlay

article1986TOG2,005 citations
Cover for Automating the design of graphical presentations of relational information

Abstract

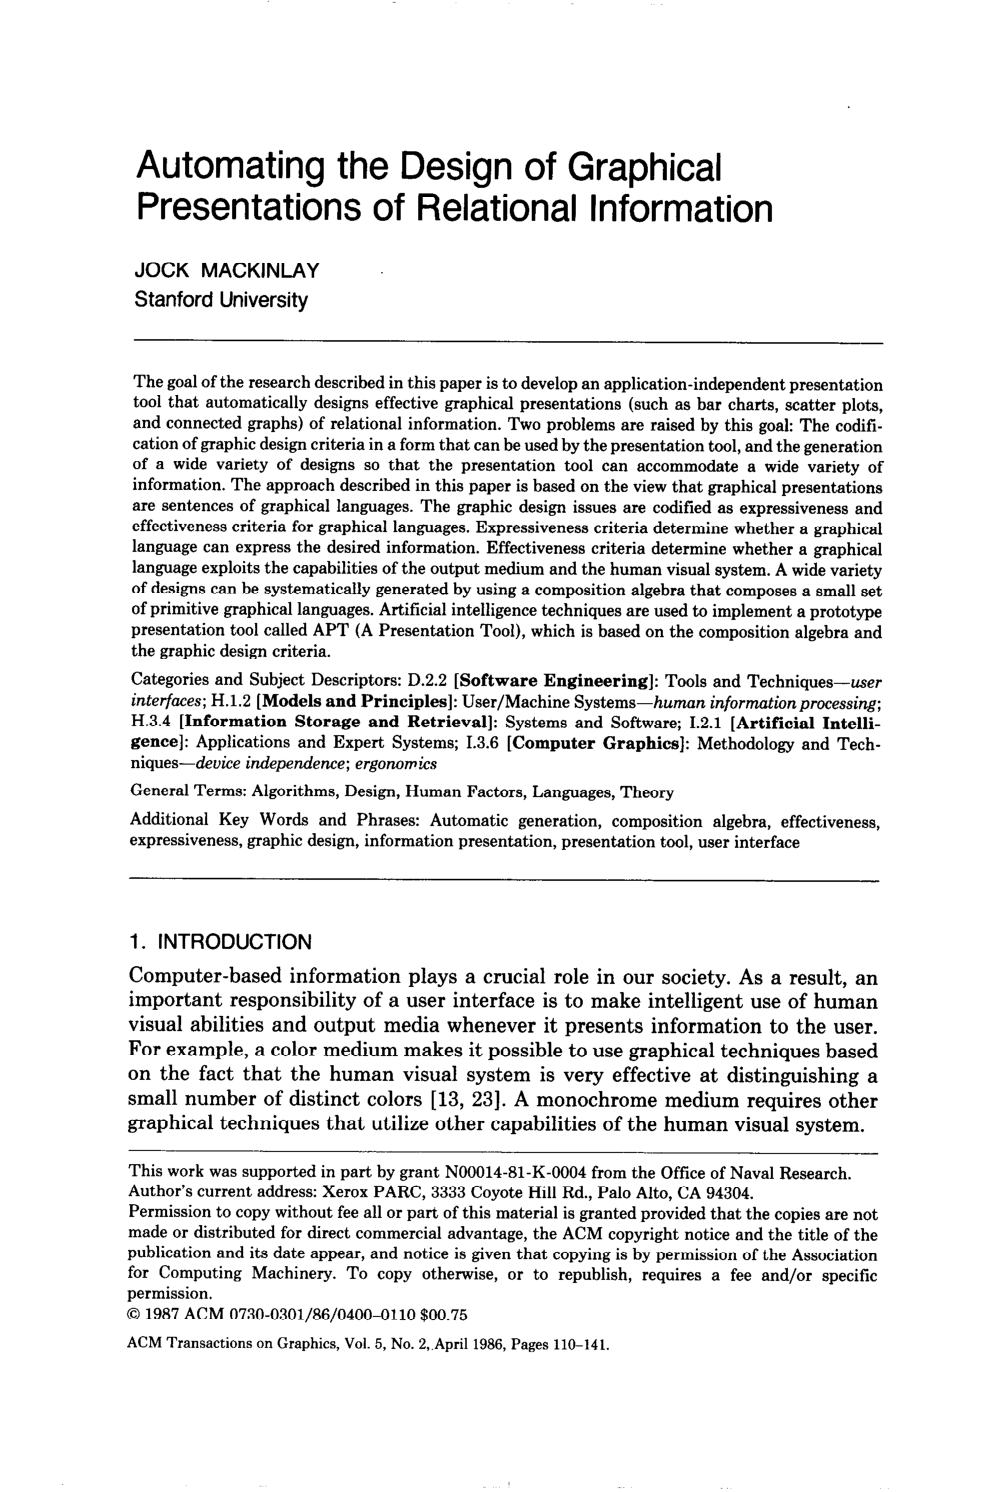
The goal of the research described in this paper is to develop an application-independent presentation tool that automatically designs effective graphical presentations (such as bar charts, scatter plots, and connected graphs) of relational information. Two problems are raised by this goal: The codification of graphic design criteria in a form that can be used by the presentation tool, and the generation of a wide variety of designs so that the presentation tool can accommodate a wide variety of information. The approach described in this paper is based on the view that graphical presentations are sentences of graphical languages. The graphic design issues are codified as expressiveness and effectiveness criteria for graphical languages. Expressiveness criteria determine whether a graphical language can express the desired information. Effectiveness criteria determine whether a graphical language exploits the capabilities of the output medium and the human visual system. A wide variety of designs can be systematically generated by using a composition algebra that composes a small set of primitive graphical languages. Artificial intelligence techniques are used to implement a prototype presentation tool called APT (A Presentation Tool), which is based on the composition algebra and the graphic design criteria.

Table of Contents

  • 1. INTRODUCTION
  • 2. RELATED WORK
  • 3. THE GRAPHICAL PRESENTATION PROBLEM
  • 4. APPROACH
  • 5. EXPRESSIVENESS
  • 6. EFFECTIVENESS
  • 7. COMPOSITION
  • 7.1 A Basis Set of Primitive Graphical Languages
  • 7.2 Some Composition Operators
  • 8. IMPLEMENTATION
  • 9. MEDIA SENSITIVITY
  • 10. DISCUSSION
  • ACKNOWLEDGMENTS
  • REFERENCES

Knowls

  1. Knowl 1 — Expressiveness Criteria for Graphical Languages

    definition

    A graphical language is defined to be expressive with respect to a target set of data facts if and only if it contains a graphical sentence that encodes all of the specified facts and encodes only those facts. Expressing additional, unintended facts is considered an expressiveness violation because such encodings convey incorrect semantic information to the viewer (such as depicting an unintended ordering on unordered categories or implying non-existent numerical relationships).

    Formally, let facts\text{facts} denote the set of relational facts to be presented, lang\text{lang} denote the formal graphical language, ss denote a graphical sentence, and lang(s)\text{lang}(s) denote the predicate that ss is syntactically valid in lang\text{lang}. The relation Encodes(s,f,lang)\text{Encodes}(s, f, \text{lang}) states that sentence ss encodes fact ff under the semantic conventions of lang\text{lang}. The expressiveness criterion is defined as:

    Expressible(facts,lang)    s[lang(s)f(ffacts    Encodes(s,f,lang)ffacts    ¬Encodes(s,f,lang))]\text{Expressible}(\text{facts}, \text{lang}) \iff \exists s \, [\text{lang}(s) \land \forall f \, (f \in \text{facts} \implies \text{Encodes}(s, f, \text{lang}) \land f \notin \text{facts} \implies \neg\text{Encodes}(s, f, \text{lang}))]

  2. Knowl 2 — Perceptual Task Effectiveness Ranking Across Data Types

    model/method

    The effectiveness of graphical languages is evaluated by ranking the human visual accuracy of the low-level perceptual tasks required to interpret their graphical encodings. Extending Cleveland and McGill's quantitative perceptual task accuracy hierarchy, the relative effectiveness of graphical encoding techniques varies systematically across quantitative, ordinal, and nominal data types:

    1. Quantitative Data: Position>Length>Angle>Slope>Area>Volume>Density>Color Saturation>Color Hue\text{Position} > \text{Length} > \text{Angle} > \text{Slope} > \text{Area} > \text{Volume} > \text{Density} > \text{Color Saturation} > \text{Color Hue}. Other visual properties (Texture, Connection, Containment, Shape) are inexpressive for quantitative scales.
    2. Ordinal Data: Position>Density>Color Saturation>Color Hue>Texture>Connection>Containment>Length>Angle>Slope>Area>Volume\text{Position} > \text{Density} > \text{Color Saturation} > \text{Color Hue} > \text{Texture} > \text{Connection} > \text{Containment} > \text{Length} > \text{Angle} > \text{Slope} > \text{Area} > \text{Volume}. Shape is inexpressive for ordinal scales because geometric shapes possess no intrinsic natural ordering.
    3. Nominal Data: Position>Color Hue>Texture>Connection>Containment>Density>Color Saturation>Shape>Length>Angle>Slope>Area>Volume\text{Position} > \text{Color Hue} > \text{Texture} > \text{Connection} > \text{Containment} > \text{Density} > \text{Color Saturation} > \text{Shape} > \text{Length} > \text{Angle} > \text{Slope} > \text{Area} > \text{Volume}.

    Channels that inherently suggest ordered magnitudes (such as size, length, area, density, and color saturation) should not be used to encode nominal data when non-ordering channels are available, as viewers naturally perceive variations in these channels as rankings.

  3. Knowl 3 — Composition Operators for Graphical Languages

    model/method

    A composition algebra synthesizes complex graphical designs from simpler graphical sentences by adhering to the Principle of Composition: compose two designs by merging graphical components that encode identical information. Three primary composition operators are defined over graphical sentences containing vertical axes vv, horizontal axes hh, and mark sets mm:

    1. Double-Axes Composition (d\bowtie_d): Composes sentences si=vihi(mi)s_i = v_i h_i (m_i) and sj=vjhj(mj)s_j = v_j h_j (m_j) that share identical horizontal and vertical axes (vi=vjv_i = v_j \neq \emptyset and hi=hjh_i = h_j \neq \emptyset, encoding the same domain sets yy and xx, respectively). It superimposes the mark sets onto a single unified coordinate system vihi(mi,mj)v_i h_i (m_i', m_j'). d\bowtie_d is associative, and it is commutative whenever mark adjustments (such as offsetting adjacent bars) are symmetric.
    2. Single-Axis Composition (s\bowtie_s): Composes sentences that share a single common axis (either vi=vjv_i = v_j \neq \emptyset or hi=hjh_i = h_j \neq \emptyset) by aligning the diagrams side-by-side or vertically along the shared dimension. s\bowtie_s is associative but non-commutative because the spatial positioning order of the sub-diagrams is preserved.
    3. Mark Composition (m\bowtie_m): Merges mark sets mim_i and mjm_j by pairing each mark oimio_i \in m_i with an object ojmjo_j \in m_j that encodes the identical domain value aa ([Encodes(oi,a,li)Encodes(oj,a,lj)][\text{Encodes}(o_i, a, l_i) \land \text{Encodes}(o_j, a, l_j)]). The composite mark inherits all position and retinal constraints (such as color or size) from both components, provided they are mutually compatible. m\bowtie_m is associative but non-commutative.

    In terms of presentation effectiveness, m\bowtie_m is preferred because it avoids increasing the number of graphical objects, whereas s\bowtie_s is the least effective because unmerged, adjacent diagrams increase the visual effort needed to perceive relationships.

  4. Knowl 4 — APT Graphical Presentation Synthesis Algorithm

    algorithm

    The APT (A Presentation Tool) synthesis algorithm automatically designs 2D static graphical presentations of relational input data through a recursive divide-and-conquer search strategy combining expressiveness filtering, effectiveness ordering, and algebraic composition.

    Input: A list of relations R=R1,R2,,RkR = \langle R_1, R_2, \dots, R_k \rangle ordered by importance; output device capabilities MM
    Output: A composite graphical design DD expressing RR
    function SynthesizePresentation(R,MR, M):
        if RR is empty then
            return EmptyDesign
        end if
        Partitions \leftarrow PartitionRelations(RR)
        for each partition pair (P1,P2)Partitions(P_1, P_2) \in \text{Partitions} ordered by importance do
            D1D_1 \leftarrow SelectPrimitiveDesign(P1,MP_1, M)
            if D1FailD_1 \neq \text{Fail} then
                D2D_2 \leftarrow SynthesizePresentation(P2,MP_2, M)
                if D2FailD_2 \neq \text{Fail} then
                    DcompD_{\text{comp}} \leftarrow TryCompose(D1,D2,MD_1, D_2, M)
                    if DcompFailD_{\text{comp}} \neq \text{Fail} then
                        return DcompD_{\text{comp}}
                    end if
                end if
            end if
        end for
        return Fail
    function SelectPrimitiveDesign(P,MP, M):
        Candidates \leftarrow FilterByExpressiveness(P,MP, M)
        SortedCandidates \leftarrow SortByEffectiveness(Candidates, PP)
        for each candidate CSortedCandidatesC \in \text{SortedCandidates} do
            if ValidateConstraints(CC) then
                return CC
            end if
        end for
        return Fail
    function TryCompose(D1,D2,MD_1, D_2, M):
        for each operator op{m,d,s}\text{op} \in \{\bowtie_m, \bowtie_d, \bowtie_s\} do
            if CanApplyOperator(op,D1,D2,M\text{op}, D_1, D_2, M) then
                DApply(op,D1,D2)D \leftarrow \text{Apply}(\text{op}, D_1, D_2)
                if CheckPerceptualInteractions(DD) then
                    return DD
                end if
            end if
        end for
        return Fail

    The algorithm searches depth-first using backward-chaining deduction (based on the RESIDUE algorithm), treating design encodings as assumable predicates that become design constraints for the rendering engine. When a composition fails (e.g., attempting to mark-compose two incompatible positional encodings), the search backtracks to select the next most effective alternative.

  5. Knowl 5 — Basis Set and Syntactic Structure of Primitive Graphical Languages

    definition

    The basis set of primitive graphical languages formalizes standard graphical techniques into structural classes based on Jacques Bertin's visual vocabulary:

    • Single-Position Languages: Syntactic form h(m)h(m) or v(m)v(m), consisting of a single horizontal axis hh or vertical axis vv constraining a set of marks mm. Expresses functional dependencies XYX \to Y, where XX is a nominal domain.
    • Apposed-Position Languages: Syntactic form vh(m)vh(m), consisting of two orthogonal axes vv and hh constraining mark set mm (such as bar charts, line charts, and plot charts). Expresses binary relations X×YX \times Y, where XX and YY are non-nominal (or where XX is nominal in plot/bar variants with discrete categories).
    • Retinal-List Languages: Syntactic form mm, consisting of marks whose spatial positions are unconstrained but whose retinal properties (color hue, shape, size, color saturation, texture, or orientation) encode data attributes. Expresses single domain sets XX or functional dependencies XYX \to Y, provided XX is non-quantitative.
    • Map Languages: Syntactic form vh(m)vh(m), where spatial mark locations encode geographical coordinates (LX1,L \to X_1, \dots).
    • Connection Languages: Syntactic form mn(ml)m_n(m_l), where mark positions of link objects mlm_l are constrained by the positions of node objects mnm_n (trees, acyclic graphs, networks). Expresses binary relationships X×XX \times X where XX is nominal.
    • Miscellaneous Languages: Syntactic form vh(m)vh(m) using specialized spatial/geometric encodings such as angular division (pie charts) or area inclusion (Venn diagrams).
  6. Knowl 6 — Formal Syntax and Semantic Mapping of Graphical Sentences

    definition

    A graphical presentation is formalized as a sentence ss of a graphical language, defined as a set of located objects in the 2D Cartesian plane:

    s{(o,l)oOlL}s \subseteq \{(o, l) \mid o \in O \land l \in L\}

    where OO is a set of 2D graphical objects with finite, non-zero height and width, and L=R2L = \mathbb{R}^2 is the set of coordinate pairs (x,y)(x, y). The geometry of located objects is described by spatial boundary functions such as Xmin(l)\text{Xmin}(l), Xpos(l)\text{Xpos}(l), Xmax(l)\text{Xmax}(l), Ymin(l)\text{Ymin}(l), Ypos(l)\text{Ypos}(l), and Ymax(l)\text{Ymax}(l).

    The semantics of a graphical sentence is specified by the ternary relation Encodes(s,facts,lang)\text{Encodes}(s, \text{facts}, \text{lang}). For a horizontal position language HorzPos\text{HorzPos} encoding a binary functional relation r(ai,bi)r(a_i, b_i), semantic mapping is defined by three rules:

    1. The axis hh encodes the dependent domain set: Encodes(h,Dom2(r),HorzPos)\text{Encodes}(h, \text{Dom}_2(r), \text{HorzPos}).
    2. Each mark oimo_i \in m encodes a distinct value of the independent domain: Encodes(oi,ai,HorzPos)\text{Encodes}(o_i, a_i, \text{HorzPos}).
    3. The position Position(oi,h)\text{Position}(o_i, h) of mark oio_i on axis hh corresponds to the dependent value bib_i via linear scaling constants scale\text{scale} and offset\text{offset}:

    Encodes(oi,ai,HorzPos)    bi=scale×(Position(oi,h)+offset)Encodes(Position(oi,h),r(ai,bi),HorzPos)\text{Encodes}(o_i, a_i, \text{HorzPos}) \implies b_i = \text{scale} \times (\text{Position}(o_i, h) + \text{offset}) \land \text{Encodes}(\text{Position}(o_i, h), r(a_i, b_i), \text{HorzPos})

  7. Knowl 7 — Principle of Importance Ordering

    model/method

    The Principle of Importance Ordering is a design rule used to achieve a lexicographic effectiveness ordering when evaluating multi-relation presentations. Because multiple distinct visual designs may utilize identical sets of visual tasks across different data attributes, the raw effectiveness ranking cannot establish a total preference order on its own.

    Under this principle, the user or application provides the presentation input as an ordered tuple of relations:

    R1,R2,,Rk\langle R_1, R_2, \dots, R_k \rangle

    where R1R_1 is the most important relation and RkR_k is the least important. The synthesis algorithm prioritizes matches such that the visual channels ranked highest in perceptual effectiveness (e.g., horizontal/vertical position) are assigned to the most important relation R1R_1, while lower-ranked visual channels (e.g., area, saturation, color hue) are assigned to progressively less important relations (R2,,RkR_2, \dots, R_k).

  8. Knowl 8 — Combinatorial Input Space of Relational Presentations

    equation

    The theoretical size NN of the space of distinct relational presentation design inputs for rr relations that share on average dd domain sets is given by:

    N=(2d1)r×(dr)!×3drN = (2^d - 1)^r \times (dr)! \times 3^{dr}

    where:

    • (2d1)r(2^d - 1)^r represents the number of possible functional dependency combinations, since each relation can map from any non-empty subset of its dd domain sets to the remaining domains.
    • (dr)!(dr)! represents the number of canonical permutation cycles formed by all possible domain-sharing configurations across the rr relations.
    • 3dr3^{dr} represents the scale-type assignments for all domain sets, where each domain set is classified as one of three measurement scales: nominal (unordered sets), ordinal (ordered sets), or quantitative (continuous/discrete numeric ranges).

    For two binary relations (r=2,d=2r = 2, d = 2), N>17,000N > 17{,}000; for four binary relations (r=4,d=2r = 4, d = 2), N>2.1×10¹⁰N > 2.1 \times 10^{10}.

  9. Knowl 9 — Inexpressibility of One-to-Many Relations in Single-Position Languages

    theoretical result

    Under the standard semantic convention where each mark object oio_i in a mark set mm is uniquely paired with an element aia_i of the independent domain Dom1(r)\text{Dom}_1(r), a single-position graphical language cannot express a one-to-many relation.

    Formally, let rr be a binary relation containing tuples r(ai,bj)r(a_i, b_j) and r(ai,bk)r(a_i, b_k) such that bjbkb_j \neq b_k. Then rr is not expressible in the horizontal position language HorzPos\text{HorzPos}:

    r(ai,bj)r(ai,bk)bjbk    ¬Expressible(r,HorzPos)r(a_i, b_j) \land r(a_i, b_k) \land b_j \neq b_k \implies \neg\text{Expressible}(r, \text{HorzPos})

    This holds because expressing both tuples requires the unique mark oio_i associated with domain value aia_i to satisfy simultaneously:

    bj=scale×(Position(oi,h)+offset)andbk=scale×(Position(oi,h)+offset)b_j = \text{scale} \times (\text{Position}(o_i, h) + \text{offset}) \quad \text{and} \quad b_k = \text{scale} \times (\text{Position}(o_i, h) + \text{offset})

    Since a single located mark oio_i can have only one physical position Position(oi,h)\text{Position}(o_i, h) on axis hh, this requires bj=bkb_j = b_k, contradicting the assumption that bjbkb_j \neq b_k.

  10. Knowl 10 — Visual Channel Interference and Media Constraints in Presentation Design

    limitation

    Automated graphical presentation synthesis is restricted by perceptual channel interference and hardware output media constraints:

    1. Size-Shape Interference: When the mark composition operator m\bowtie_m combines size and shape encodings on the same mark set, rendering objects at small sizes degrades human perceptual discrimination of geometric shapes. The rendering engine must enforce lower bounds on mark size.
    2. Monochrome Output Restrictions: On monochrome displays, color hue is unavailable, leaving only texture, saturation, and size for ordinal encodings. However, saturation effectiveness degrades when rendering more than four or five grayscale levels because adjacent gray steps blend together indistinguishably.
    3. Channel Overlap Conflicts in Mark Composition: Mark composition m\bowtie_m cannot merge two graphical designs if both designs require the same retinal visual channel (e.g., both utilizing mark size or both utilizing color hue) to encode different underlying domain attributes.

Coverage note — None was omitted; all key theoretical principles, formal definitions, composition algebra rules, perceptual task rankings, algorithms, complexity bounds, and system limitations from the paper are fully covered.

References

  1. 1.BEACH, R. J. Setting tables and illustrations with style. Ph.D. dissertation, Dept. of Computer Science, Univ. of Waterloo, Waterloo, Ont., Canada, 1985. Also Xerox PARC Tech. Rep. CSL-85-3.
  2. 2.BEACH, R., AND STONE, M. Graphical style—towards high quality illustrations. Computer Graph. (SIGGRAPH) 17, 3 (1983), 127-135.
  3. 3.BERTIN, J. Semiology of Graphics, W. J. Berg, Tr. University of Wisconsin Press, Milwaukee, Wis., 1983.
  4. 4.BOWMAN, W. J. Graphic Communication. Wiley, New York, 1968.
  5. 5.CLEVELAND, W. S. The Elements of Graphing Data. Wadsworth Advanced Books and Software, Monterey, Calif., 1980.
  6. 6.CLEVELAND, W. S., AND MCGILL, R. Graphical perception: Theory, experimentation and application to the development of graphical methods. J. Am. Stat. Assoc. 79, 387 (Sept. 1984), 531-554.
  7. 7.ENDERTON, H. B. A Mathematical Introduction to Logic. Academic Press, Orlando, Fla., 1972.
  8. 8.FEINER, S. APEX: An experiment in the automated creation of pictorial explanations. IEEE Comput. Graph. Appl. 5, 11 (Nov. 1985), 29-37.
  9. 9.FINGER, J. J., AND GENESERETH, M. R. RESIDUE—A deductive approach to design synthesis. Tech. Rep. KSL-85-1, Computer Science Dept., Stanford Univ., Stanford, Calif., Jan. 1985.
  10. 10.FRIEDELL, M. Automatic graphics environment synthesis. Ph.D. dissertation, Dept. of Computer Engineering and Science, Case Western Reserve Univ., Cleveland, Ohio, 1983. Also Computer Corporation of America Tech. Rep. CCA-83-03.
  11. 11.GNANAMGARI, S. Information presentation through default displays. Ph.D. dissertation, Dept. of Decision Sciences, The Wharton School, Univ. of Pennsylvania, Philadelphia, Pa., May 1981.
  12. 12.KAHN, K. M. Creation of computer animation from story descriptions. Ph.D. dissertation, MIT-AI-540, Massachusetts Institute of Technology, Cambridge, Mass., Aug. 1979.
  13. 13.KAHNEMAN, D., AND HENIK, A. Perceptual organization and attention. In Perceptual Organization. M. Kubovy and J. R. Pomerantz, Eds. Lawrence Erlbaum, Hillsdale, N.J., 1981, pp. 181-211.
  14. 14.KNUTH, D. E. The Art of Computer Programming, vol. 1. Addison-Wesley, Reading, Mass., 1973, pp. 176-179.
  15. 15.LOCKWOOD, A. Diagrams: A Visual Survey of Graphs, Maps, Charts and Diagrams for the Graphic Designer. Watson-Guptill, 1969.
  16. 16.MACKINLAY, J. Automatic design of graphical presentations. Ph.D. dissertation, Computer Science Dept., Stanford Univ., Stanford, Calif., 1986. Also Tech. Rep. Stan-CS-86-1038.
  17. 17.MACKINLAY, J., AND GENESERETH, M. R. Expressiveness and language choice. Data Knowl. Eng. 1, 1 (June 1985), 17-29.
  18. 18.RUSSELL, S. The compleat guide to MRS. KSL-85-12, Computer Science Dept., Stanford Univ., Stanford, Calif., June 1985.
  19. 19.SCHMID, C. F. Statistical Graphics: Design Principles and Practices. Wiley, New York, 1983.
  20. 20.STEVENS, S. S. On the theory of scales of measurement. Science, 103 2684 (June 1946), 677-680.
  21. 21.TUFTE, E. R. The Visual Display of Quantitative Information. Graphics Press, Cheshire, Conn., 1983.
  22. 22.ULLMAN, J. D. Principles of Database Systems. Computer Science Press, Rockville, Md., 1980.
  23. 23.WARE, C., AND BEATTY, J. C. Using colour as a tool in discrete data analysis. Tech. Rep. CS-85-21, Computer Science Dept., Univ. of Waterloo, Waterloo, Ont., Canada, Aug. 1985.
  24. 24.ZDYBEL, F., GREENFELD, N. R., YONKE, M. D., AND GIBBONS, J. An information presentation system. In 7th International Joint Conference on Artificial Intelligence (Vancouver, Canada, Aug.). AAAI, Menlo Park, Calif., 1981, pp. 978-984.

Citation

MLA
Mackinlay, J. “Automating the Design of Graphical Presentations of Relational Information”. ACM Transactions on Graphics, vol. 5, no. 2, 1986, pp. 110–41, https://doi.org/10.1145/22949.22950.
APA
Mackinlay, J. (1986). Automating the design of graphical presentations of relational information. ACM Transactions on Graphics, 5(2), 110–141. https://doi.org/10.1145/22949.22950
Chicago
Mackinlay, J. 1986. “Automating the Design of Graphical Presentations of Relational Information”. ACM Transactions on Graphics 5 (2): 110–41. https://doi.org/10.1145/22949.22950.
Harvard
Mackinlay, J. (1986) “Automating the design of graphical presentations of relational information”, ACM Transactions on Graphics, 5(2), pp. 110–141. Available at: https://doi.org/10.1145/22949.22950.
Vancouver
1. Mackinlay J (1986) Automating the design of graphical presentations of relational information. ACM Transactions on Graphics 5:110–141

BibTeX

@article{Mackinlay_1986, title={Automating the design of graphical presentations of relational information}, volume={5}, ISSN={1557-7368}, url={http://dx.doi.org/10.1145/22949.22950}, DOI={10.1145/22949.22950}, number={2}, journal={ACM Transactions on Graphics}, publisher={Association for Computing Machinery (ACM)}, author={Mackinlay, Jock}, year={1986}, month=Apr, pages={110–141} }
Metadata:Crossref

Source Code

This paper has an official code repository available. Click below to access the source code.

View Repository

Access the Paper

This paper is available from its original source. Click below to access the PDF.

Open PDF