NEXUS : An Agentic Framework for Time Series Forecasting
Sarkar Snigdha Sarathi Das$^{1, 2}$, Palash Goyal$^{1}$, Mihir Parmar$^{1}$, Nanyun Peng$^{1}$, Vishy Tirumalashetty$^{1}$, Chun-Liang Li$^{1}$, Rui Zhang$^{2}$, Jinsung Yoon$^{1}$ and Tomas Pfister$^{1}$
$^{1}$Google, $^{2}$Pennsylvania State University
Abstract
Time series forecasting is not just numerical extrapolation, but often requires reasoning with unstructured contextual data such as news or events. While specialized Time Series Foundation Models (TSFMs) excel at forecasting based on numerical patterns, they remain unaware of real-world textual signals. Conversely, while LLMs are emerging as zero-shot forecasters, their performance remains uneven across domains and contextual grounding. To bridge this gap, we introduce NEXUS , a multi-agent forecasting framework that decomposes prediction into specialized stages: isolating macro-level and micro-level temporal fluctuations, and integrating contextual information when available before synthesizing a final forecast. This decomposition enables NEXUS to adapt from seasonal signals to volatile, event-driven information without relying on external statistical anchors or monolithic prompting. We show that current-generation LLMs possess stronger intrinsic forecasting ability than previously recognized, depending critically on how numerical and contextual reasoning are organized. Evaluated on data strictly succeeding LLM knowledge cutoffs spanning Zillow real estate metrics and volatile stock market equities, NEXUS consistently matches or outperforms state-of-the-art TSFM and strong LLM baselines. Beyond numerical accuracy, NEXUS produces high-quality reasoning traces that explicitly show the fundamental drivers behind each forecast. Our results establish that real-world forecasting is an agentic reasoning problem extending well beyond only sequence modeling.
$^{\clubsuit}$ Please correspond with [email protected], {palashgoyal,mihirparmar}@google.com
Executive Summary: NEXUS is a multi-agent system that uses large language models to produce time-series forecasts by combining numerical patterns with unstructured textual context such as news and events. The work addresses a persistent limitation: specialized time-series models capture historical trends well but ignore real-world drivers, while standalone LLMs handle text yet falter on precise numerical extrapolation.
The authors set out to test whether decomposing forecasting into separate reasoning stages could overcome those weaknesses and deliver both higher accuracy and explicit, human-readable justifications. They built the framework around four coordinated agents that first organize raw historical data, then produce a broad macro outlook and a detailed micro outlook, and finally synthesize the two views while learning from prior errors through a calibration loop.
They evaluated the system on data collected strictly after the models’ January 2025 knowledge cutoff. The test sets covered weekly Zillow housing metrics for 15 major U.S. cities and closing prices for seven volatile equities, with forecast horizons ranging from four to 26 weeks. Performance was measured against a strong Chain-of-Thought LLM baseline and the TimesFM-2.5 time-series foundation model, using both MAPE and RMSE.
NEXUS matched or exceeded the numerical accuracy of TimesFM-2.5 and consistently outperformed the LLM baseline, with the largest gains on the Zillow data where temporal dynamics matter most. Independent judge models preferred NEXUS reasoning on four qualitative criteria—domain relevance, event linkage, logic-to-number consistency, and analytical depth—by margins of 60–97 percent. Ablation tests confirmed that removing the macro view, the micro view, or the calibration step each degraded accuracy, showing that all three elements contribute.
These results indicate that modern LLMs, when given a structured workflow rather than a single prompt, can integrate qualitative signals with quantitative patterns at a level previously thought to require specialized numerical architectures. The added benefit of transparent reasoning traces supports auditability and trust in high-stakes settings such as investment, real-estate planning, and operations.
Organizations facing forecasts that mix seasonality with sudden events should pilot NEXUS-style agentic pipelines on their own data streams. The immediate next steps are to test the approach on additional domains, run statistical replicates to quantify variance, and measure end-to-end decision impact in a controlled deployment.
The evaluation is currently limited to two data sources and single-run results because of inference cost; broader validation and repeated trials would increase confidence before large-scale adoption.
1. Introduction
Section Summary: Time series forecasting has long relied on specialized models that analyze patterns in numerical data, but these approaches often miss crucial real-world context from events and text. Large language models can interpret such qualitative information and reason about it, yet they tend to falter at precise numerical predictions. The paper introduces Nexus, a multi-agent framework that separates broad trend analysis from detailed time-series modeling, combines them through synthesis and calibration, and outperforms dedicated forecasting models on volatile stock and housing datasets while producing interpretable explanations.
Time series forecasting is a pivotal task supporting decision-making in numerous high-stakes domains ([1, 2, 3, 4]). Historically, the heterogeneity of time series patterns required specialized, domain-specific algorithms. Recently, the advent of Time Series Foundation Models (TSFMs) ([5, 6, 7, 8, 9]) has established a unified forecasting paradigm. By pre-training large-scale on massive corpora of numerical sequences, these models achieve state-of-the-art performance in identifying complex seasonalities, trends, and long-range dependencies, effectively capturing the structural dynamics of the training distribution.
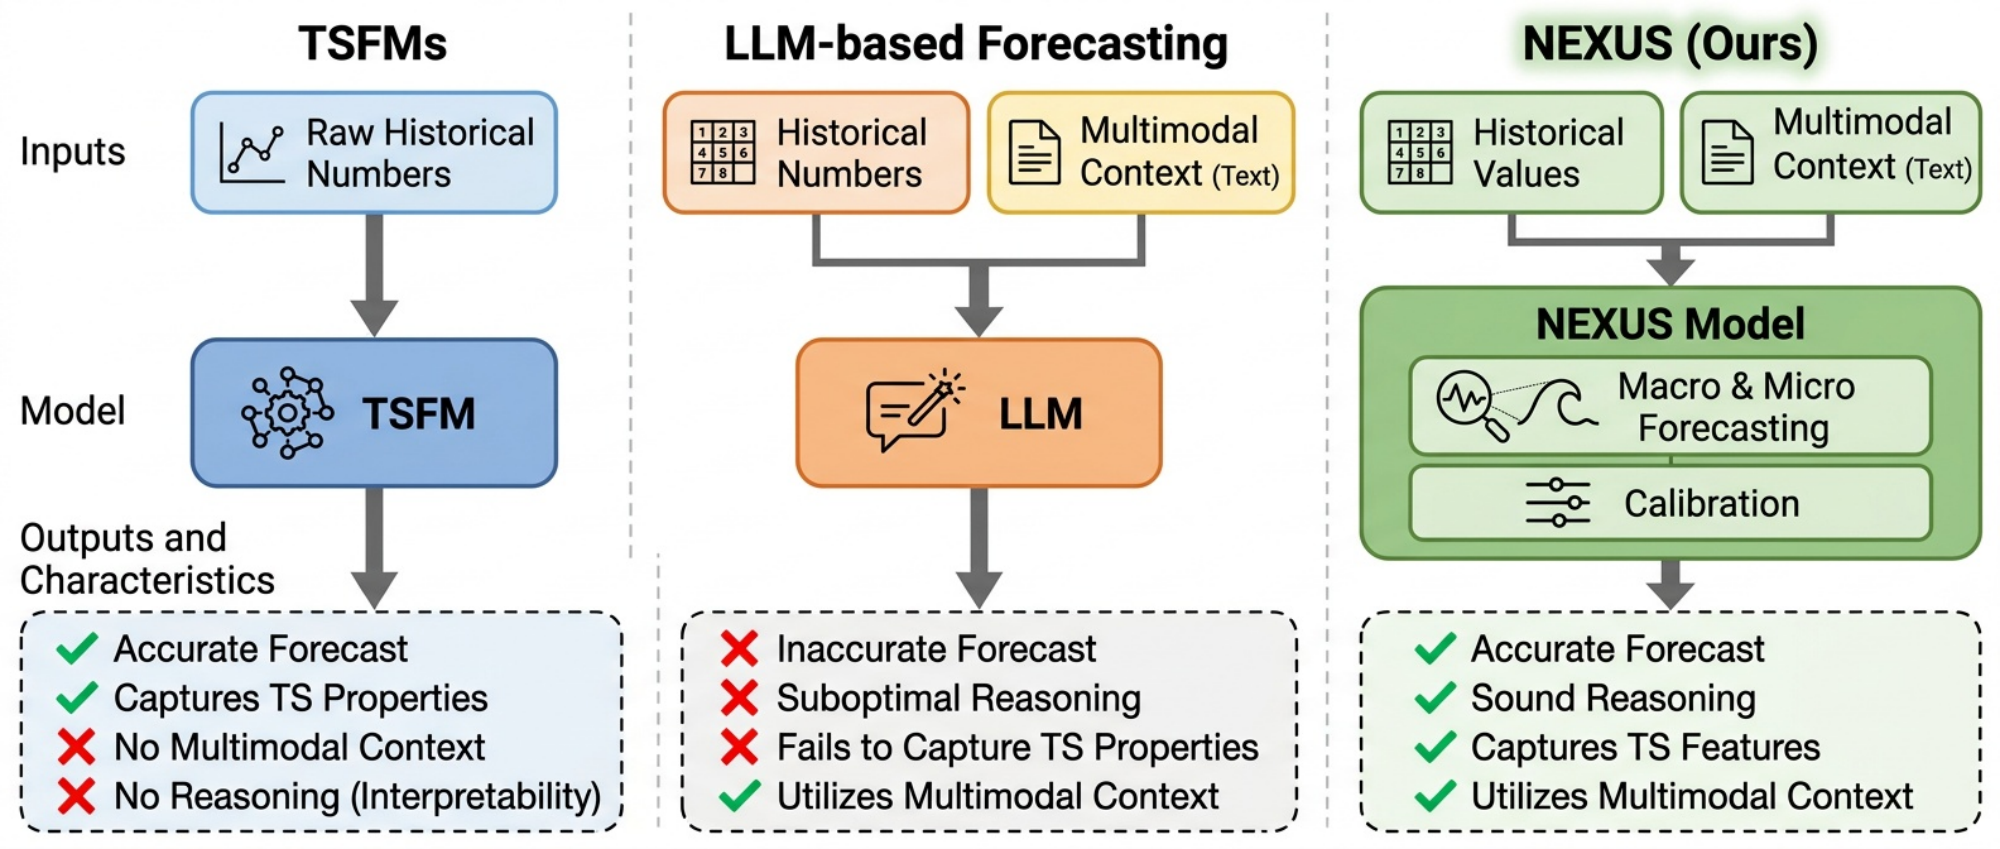
However, relying solely on structured numerical sequences isolates forecasting models from broader real-world narratives. While TSFMs can utilize numerical covariates to provide context about the target variable, they operate in a multimodal vacuum. Because real-world time series are often the quantitative outcomes of qualitative events and unstructured textual signals, TSFMs remain vulnerable to structural breaks and regime shifts where historical data alone no longer applies. Conversely, while Large Language Models (LLMs) can easily parse this crucial unstructured context and apply advanced reasoning, their architectures lack the autoregressive mathematical mechanisms necessary for precise numerical pattern recognition.
Although early works have attempted to bridge this gap through parameter-efficient model reprogramming ([10, 11, 12]) or discrete tokenization pipelines ([8]), LLMs exhibit suboptimal performance as standalone numerical forecasters. As demonstrated by ([13]), forcing LLMs to auto-regressively predict continuous numerical values frequently yields performance inferior to TSFMs, as their architectures lack an intrinsic mechanism for temporal dependencies. Thus, researchers currently face a compromise: discard critical qualitative context to utilize statistical models, or rely on zero-shot numerical reasoning from LLMs that is prone to be ineffective in capturing time series properties.
To address these limitations, recent literature advocates for multimodal, agentic forecasting paradigms ([14]) that integrate essential textual context ([15, 16]) and explicit reasoning ([17, 18]). However, many recent adaptive or agentic forecasting systems still primarily automate numerical workflows, such as model arbitration, feature analysis, tool use, or forecast refinement ([19, 20, 21]). In this work, we view LLM-era agentic forecasting not merely as tool orchestration, but as a process where textual evidence and temporal reasoning are central to prediction. Optimal forecasting in volatile domains requires synthesizing statistical properties with fundamental drivers; unimodal approaches inherently fail because numerical models miss shock events while LLMs struggle with multi-seasonal periodicity.
To this end, we introduce $\textsc{Nexus}$, a fully LLM-driven multi-agent framework that disentangles these two requirements. Rather than forcing a single model to handle everything at once, $\textsc{Nexus}$ separately models a coarse-level outlook to capture the high-level trend, and a granular-level outlook to capture specific time series features and impactful catalysts. Finally, a synthesizer agent merges these dual perspectives into mathematically grounded forecast, resulting in stronger overall performance. Additionally, $\textsc{Nexus}$ features a domain-level calibration loop. By evaluating past prediction errors against ground truth across multiple historical splits, the system generates specific review guidelines. This allows the synthesizer to learn how to weigh conflicting signals for a specific forecasting task.
To prevent knowledge leakage, we evaluate $\textsc{Nexus}$ on data strictly succeeding the underlying LLMs' knowledge cutoffs across two distinct domains: Highly volatile stock market datasets across 7 tickers and Zillow Home Counts metrics across 15 major US metropolitan areas. Utilizing Gemini-3.1-Pro ([22]) and Claude-Sonnet-4.5 ([23]), $\textsc{Nexus}$ consistently outperforms both the flagship TimesFM-2.5 ([5]) and Zero-Shot CoT-baselines ([18]). Across both text-driven forecasting for volatile stock markets and intrinsic numerical modeling for periodic real estate data, $\textsc{Nexus}$ achieves superior numerical accuracy while generating highly interpretable reasoning. Our primary contributions are:
- We demonstrate that effective LLM forecasting requires disentangling coarse-level trends from granular time series features to overcome LLMs' intrinsic numerical limitations.
- We introduce $\textsc{Nexus}$, a multi-agent framework that models macro (coarse) and micro (granular) outlooks before dynamically synthesizing them into a single, robust forecast.
- We show $\textsc{Nexus}$ achieves state-of-the-art results on highly seasonal (Zillow) and volatile (Stocks) datasets, matching or outperforming dedicated TSFMs like TimesFM-2.5 even in numerical settings.
2. Problem Formulation
Section Summary: The task involves forecasting future values in a univariate time series while also producing explicit natural-language explanations for those predictions, drawing on a mix of past numerical observations and unstructured text such as news reports or summaries. The available context consists of a sequence of numbers together with matching textual entries covering the same historical window. The goal is therefore to learn a single mapping that ingests this multimodal context and returns both the projected numerical values for the next several steps and the underlying causal reasoning that justifies them.
We formulate the task of multimodal time series forecasting with explicit reasoning as jointly predicting the future values of a sequence and generating their underlying causal rationale, based on a multimodal observed historical context. Formally, let $\mathbf{X}{1:\tau} = (x_1, x_2, \dots, x\tau)$ represent a univariate time series of numerical values observed over a context window of length $\tau$. Concurrently, let $\mathbf{E}{1:\tau} = (e_1, e_2, \dots, e\tau)$ represent the sequence of associated unstructured textual data (e.g., news, financial reports, or macroeconomic summaries) corresponding to each timestep in the context window. The complete historical context is thus defined as the multimodal tuple $\mathcal{C}{1:\tau} = (\mathbf{X}{1:\tau}, \mathbf{E}_{1:\tau})$.
Given this context $\mathcal{C}{1:\tau}$, the primary objective is to generate a numerical forecast for the subsequent $T$ timesteps, denoted as $\mathbf{X}{\tau+1:\tau+T} = (x_{\tau+1}, x_{\tau+2}, \dots, x_{\tau+T})$. Crucially, unlike traditional purely numerical forecasting, our goal is also to generate corresponding natural language reasoning, denoted as $\mathbf{R}$. This reasoning $\mathbf{R}$ provides an explicit reasoning of the fundamental catalysts, and events driving the predicted values, $\mathbf{R}{\tau+1:\tau+T} = (r{\tau+1}, \dots, r_{\tau+T})$.
Therefore, the problem can be formally framed as learning a mapping $\mathcal{F}$ that synthesizes both quantitative data and qualitative context to output both the predicted values and their justifications:
$ \mathcal{F}(\mathbf{X}{1:\tau}, \mathbf{E}{1:\tau}) \rightarrow (\mathbf{X}_{\tau+1:\tau+T}, \mathbf{R}) $
3. The $\textsc{Nexus}$ Framework
Section Summary: The Nexus framework tackles complex forecasting by breaking the task into three sequential stages handled by specialized agents rather than a single model. First, a contextualization agent cleans and organizes raw historical data into a clear timeline of causes and effects. Next, separate macro and micro agents generate broad trend outlooks and detailed step-by-step projections, which a synthesizer agent then merges into final numerical forecasts and explanations while learning from past errors to improve over time.
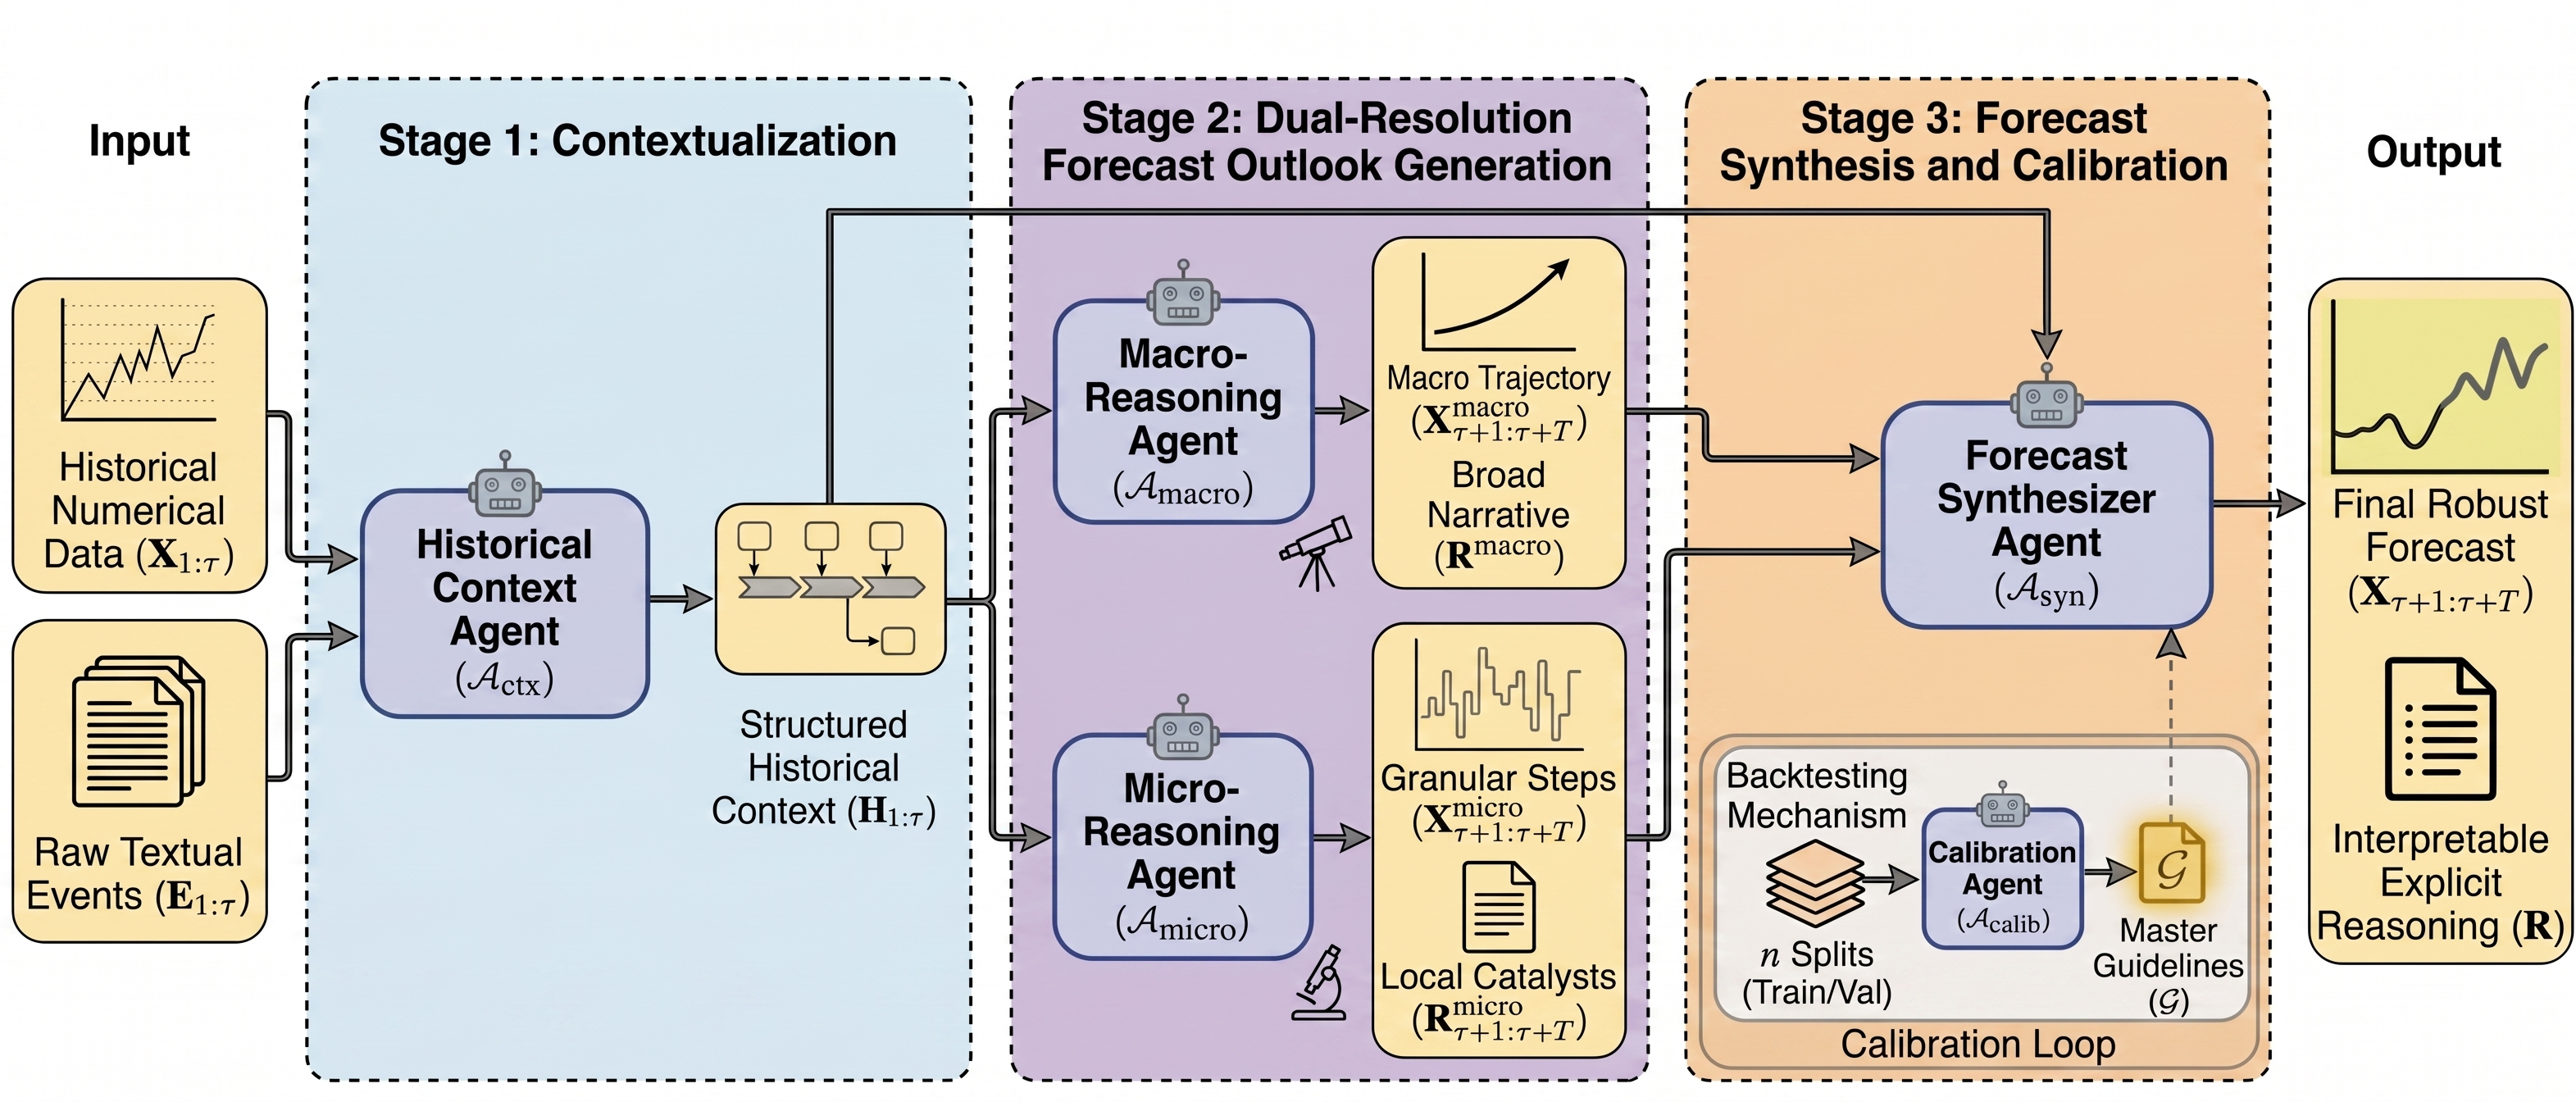
Rather than relying on a single monolithic model to directly approximate the mapping $\mathcal{F}(\mathbf{X}{1:\tau}, \mathbf{E}{1:\tau}) \rightarrow (\mathbf{X}_{\tau+1:\tau+T}, \mathbf{R})$, as illustrated in Figure 2, $\textsc{Nexus}$ decomposes the forecasting task into three distinct, logical stages: Contextualization, Dual-Resolution Forecast Outlook Generation, and Forecast Synthesis and Calibration.
By systematically breaking down the problem, the framework first structures the raw multimodal context $\mathcal{C}{1:\tau}$, then projects future outlooks reasonings across different forecast resolutions, and finally utilizes a Forecast Synthesizer Agent to merge these perspectives into a final forecast. This multi-agent system allows $\textsc{Nexus}$ to dynamically synthesize qualitative insights with historical trends, producing robust numerical predictions $\mathbf{X}{\tau+1:\tau+T}$ as well as explicit interpretable reasoning $\mathbf{R}$.
3.1 Contextualization
Feeding raw, multimodal data directly into an LLM often leads to cognitive overload, particularly when processing long sequences of numerical values intermixed with dense, unstructured text [24]. To mitigate the risk of the model losing track of critical information in long contexts, the first stage of $\textsc{Nexus}$ employs a dedicated agent to clean and structure the historical data $\mathcal{C}_{1:\tau}$ before any forecasting occurs.
Historical Context Agent ($\mathcal{A}_{ctx}$). This agent acts as a mapping function $\mathcal{A}{ctx}(\mathbf{X}{1:\tau}, \mathbf{E}{1:\tau}) \rightarrow \mathbf{H}{1:\tau}$, transforming the raw multimodal context paired with basic time-series features into a highly structured, chronological timeline $\mathbf{H}{1:\tau}$. For each timestep $t$, the agent receives the available external textual information $e_t$ alongside the numerical value $x_t$. It analyzes this data to find and primarily include the most important factors driving the value change in an organized manner, effectively filtering out noise. Rather than generating a generic, monolithic summary, $\mathcal{A}{ctx}$ constructs a specific, step-by-step list where each element $h_t \in \mathbf{H}_{1:\tau}$ explicitly links $x_t$ with a concise, organized summary of these key driving factors. This process ensures that downstream forecasting agents receive a clear, high-fidelity signal of cause and effect, allowing them to efficiently allocate their reasoning for accurate forecasting rather than parsing messy, unstructured texts.
3.2 Dual-Resolution Forecast Outlook Generation
A robust forecast requires analyzing the time series across multiple temporal resolutions. If a model solely focuses on the overarching trend, it risks missing crucial short-term details like volatility. On the other hand, if it only evaluates step-by-step changes, it can easily lose track of broader fundamental shifts. To address this, $\textsc{Nexus}$ generates two distinct, complementary outlooks from the structured history $\mathbf{H}_{1:\tau}$.
Macro-Reasoning Agent ($\mathcal{A}_{macro}$). This agent takes a top-down approach. It analyzes the structured causal memory $\mathbf{H}{1:\tau}$ to map out a broad trajectory for the entire forecast horizon $T$. By focusing on the macro picture, it establishes the expected regime. Formally, it acts as a mapping $\mathcal{A}{macro}(\mathbf{H}{1:\tau}) \rightarrow (\mathbf{X}^{macro}{\tau+1:\tau+T}, \mathbf{R}^{macro})$, representing the general outlook. Narrative $\mathbf{R}^{macro}$ ensures the final forecast stays aligned with broader fundamental shifts.
Micro-Reasoning Agent ($\mathcal{A}_{micro}$). In contrast, this agent takes a more granular approach. It walks through the forecast horizon step-by-step. For every single future timestep $t \in [\tau+1, \tau+T]$, it carefully evaluates immediate catalysts, expected short-term shifts, and localized volatility based on $\mathbf{H}{1:\tau}$. It acts as a mapping $\mathcal{A}{micro}(\mathbf{H}{1:\tau}) \rightarrow (\mathbf{X}^{micro}{\tau+1:\tau+T}, \mathbf{R}^{micro}_{\tau+1:\tau+T})$, outputting a highly specific reasoning $r^{micro}_t$ and a corresponding numerical value $x^{micro}_t$ for each individual step. This ensures the system remains highly responsive to immediate, short-term events.
3.3 Forecast Synthesis and Calibration
The final stage of the $\textsc{Nexus}$ framework involves merging the dual perspectives generated by the macro and micro reasoning agents, and continuously learning from past prediction errors to refine the forecasting strategy over time.
Forecast Synthesizer Agent ($\mathcal{A}_{syn}$). This agent computes the final forecast by dynamically evaluating and merging the macro and micro perspectives. It synthesizes the structured history with the dual outlooks, conditioned on a set of learned guidelines $\mathcal{G}$ (initially empty) from calibration. Formally, it acts as a mapping $\mathcal{A}{syn}(\mathbf{H}{1:\tau}, \mathbf{X}^{macro}, \mathbf{R}^{macro}, \mathbf{X}^{micro}, \mathbf{R}^{micro}, \mathcal{G}) \rightarrow (\mathbf{X}{\tau+1:\tau+T}, \mathbf{R})$. For each timestep, $\mathcal{A}{syn}$ synthesizes the broad trajectory of the Macro Outlook with the specific, event-driven catalysts of the Micro Outlook, producing the final numerical forecast $\mathbf{X}_{\tau+1:\tau+T}$ alongside explicit reasoning $\mathbf{R}$ that justifies how it weighted the two views.
Calibration Agent ($\mathcal{A}_{calib}$). To adapt to different domains without requiring any additional instructions design, $\textsc{Nexus}$ employs a forward-simulation backtesting mechanism. The historical data is divided into $n$ sequential backtest splits, designating the final split as a hidden validation set and the preceding splits as "training" folds for guideline generation.
The framework first generates baseline predictions across all folds in parallel. For each training fold $i$, the calibration agent ($\mathcal{A}_{calib}$) analyzes the prediction error and the underlying reasoning to generate specific critique rules $\mathcal{G}i$ aimed at fixing estimation errors. Because guidelines based on a single historical split might overfit to temporary market anomalies, the rules from all $n-1$ training folds are intersected to produce a robust, generalized set of master guidelines: $\mathcal{G} = \bigcap{i=1}^{n-1} \mathcal{G}_i$.
To ensure these synthesized guidelines are actually beneficial and do not degrade future performance, the synthesized guidelines $\mathcal{G}$ undergo a validation pass. They are applied to the final test set only if they yield a performance improvement of at least $k%$ on the hidden validation fold. This criterion ensures robust optimization without overfitting.
4. Experiments
Section Summary: The experiments section demonstrates that the Nexus framework delivers strong results for time series forecasting on real-world data. The authors use carefully chosen post-2025 datasets on housing inventory and stock prices, along with models such as Gemini and Claude, to test predictions both with and without added textual context while avoiding data leakage. They compare against baselines like TimesFM, evaluate reasoning quality, and measure how each part of the framework contributes to overall accuracy.
In this section, we demonstrate that the $\textsc{Nexus}$ framework is highly effective for time series forecasting across diverse settings. We first detail our experimental setup, including the datasets, models, and baselines designed to ensure a rigorous, zero-shot evaluation without data leakage (§ 4.1). We then present our main results for contextual multimodal forecasting (§ 4.2) and purely numerical forecasting without context (§ 4.3). Finally, we evaluate the qualitative reasoning capabilities of our framework (§ 4.4) and conduct a component analysis to quantify the impact of different components of $\textsc{Nexus}$ (§ 4.5).
4.1 Experimental Setup
To rigorously evaluate the forecasting capabilities of LLMs and the efficacy of the $\textsc{Nexus}$ framework, we designed an experimental setup that explicitly controls for data leakage. Evaluating LLMs on historical time series data prior to their training cutoff date introduces a critical flaw: models may simply recall actual numerical values or associated real-world events from their pre-training corpora, artificially inflating performance metrics.
Datasets.
To ensure a genuine, zero-shot forecasting evaluation, we curated two real-world datasets spanning the period immediately following the models' knowledge cutoff (January 2025):
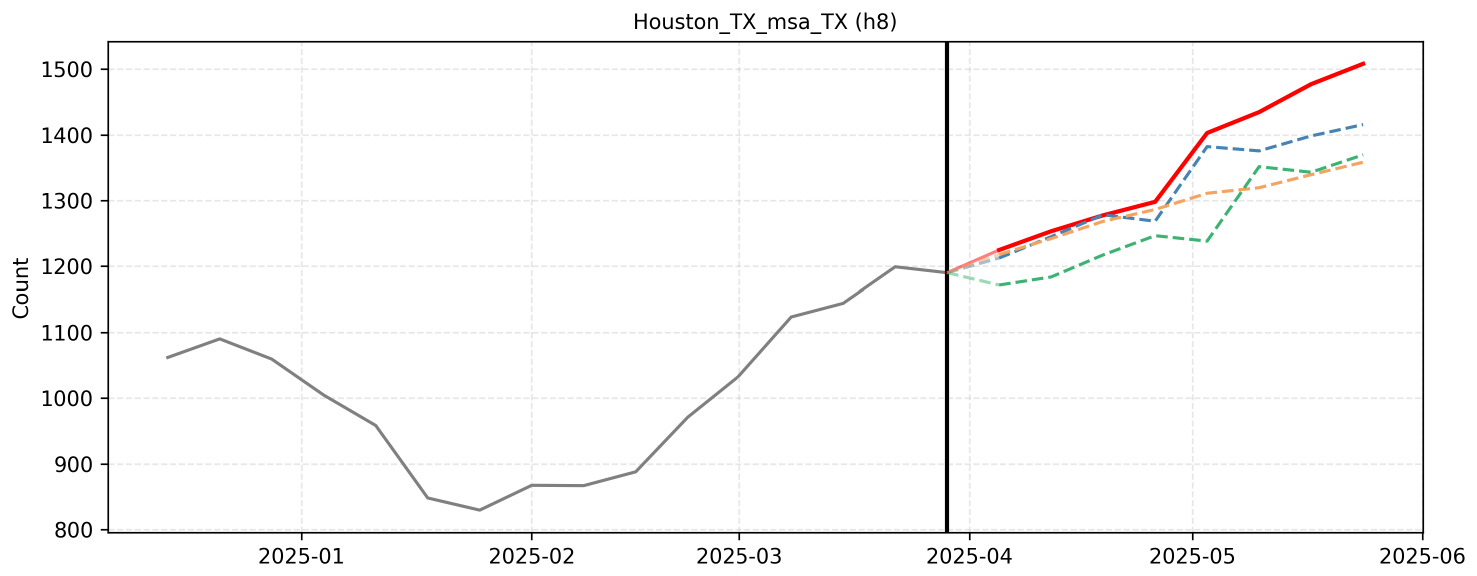
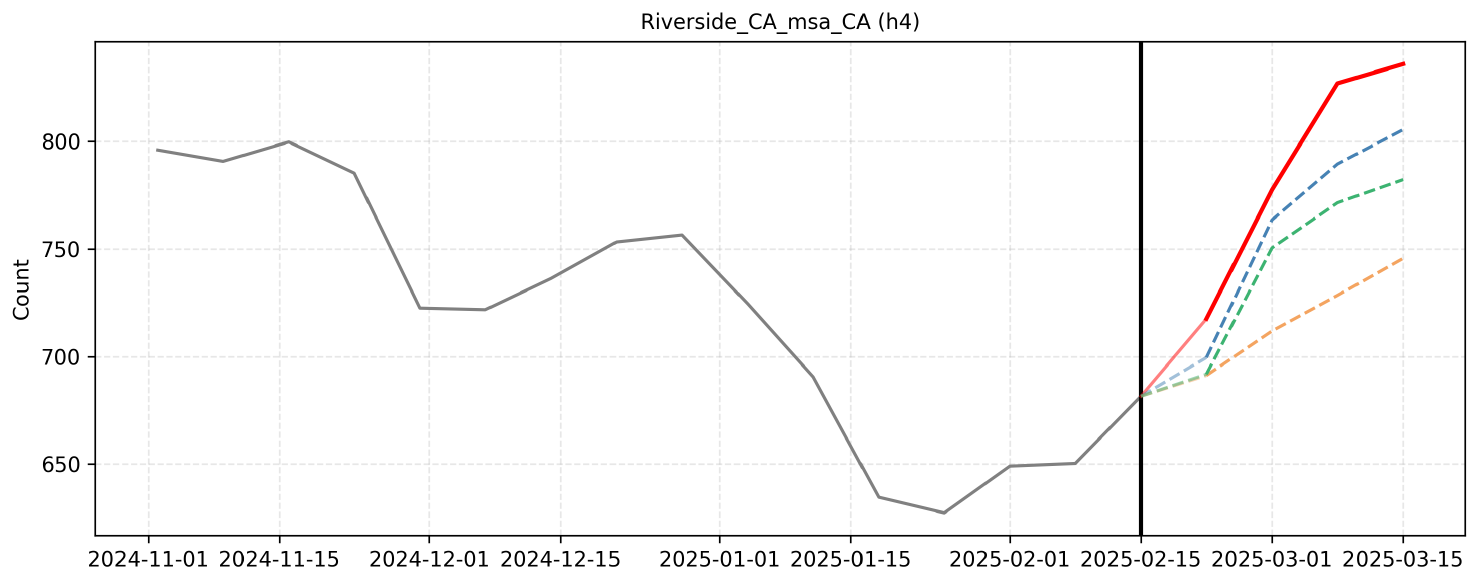
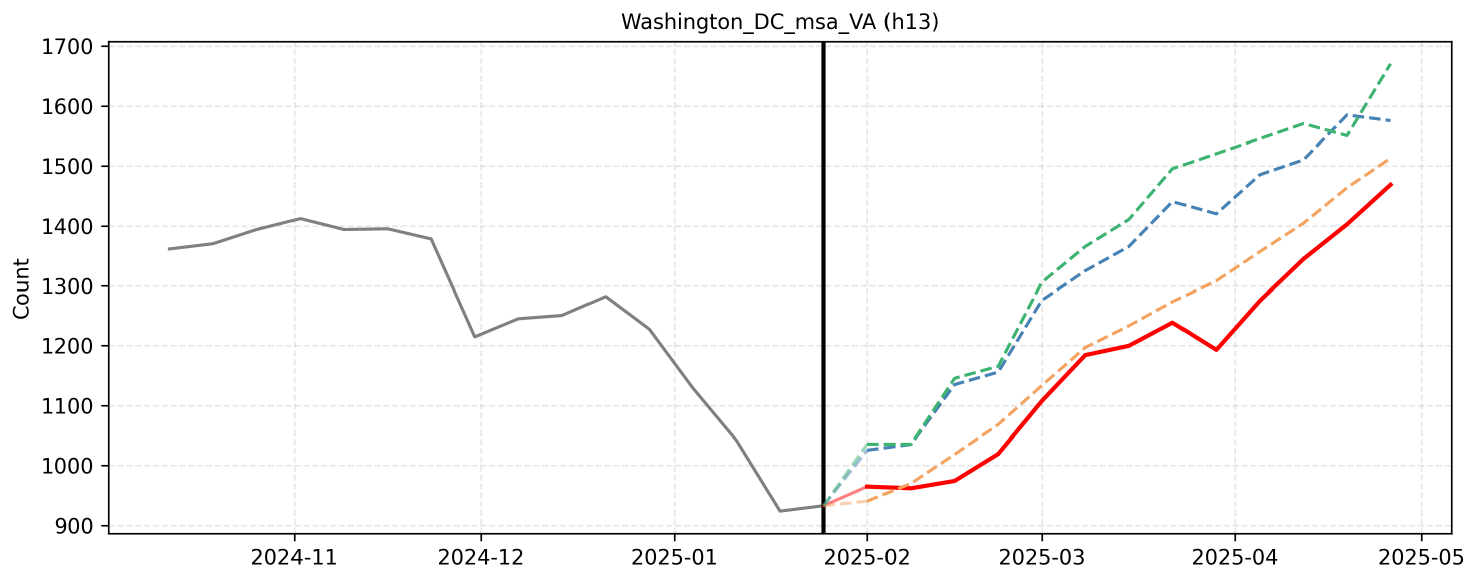
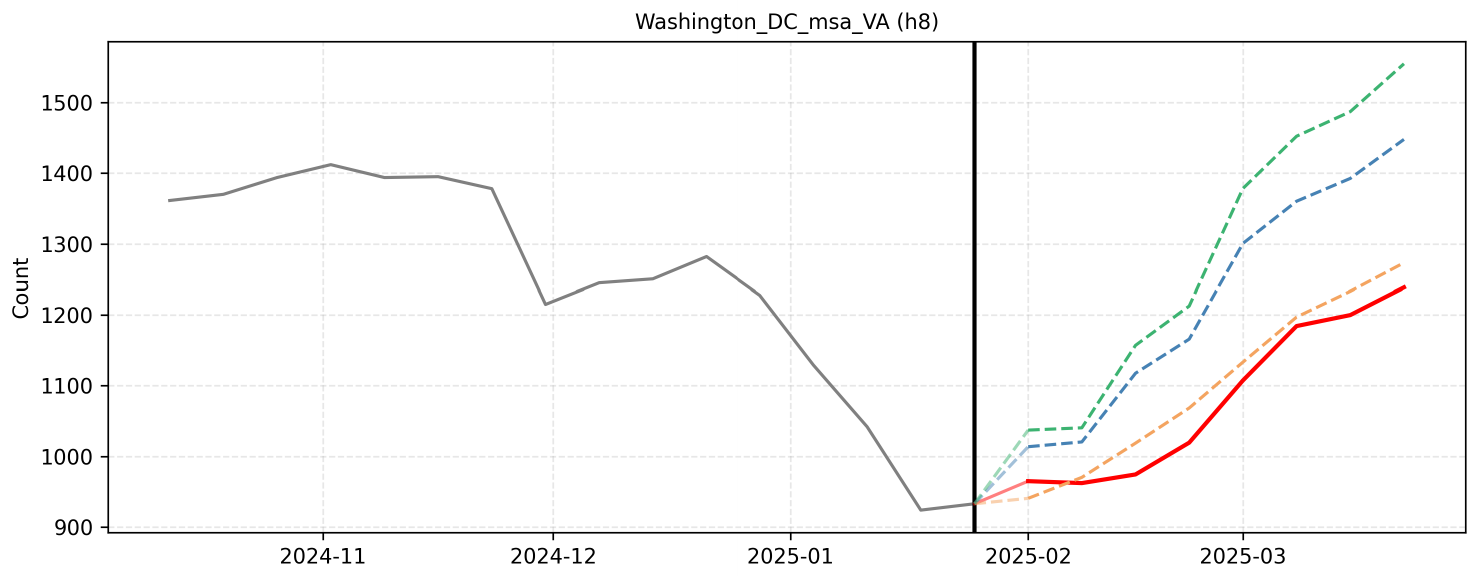
- Zillow Real Estate Metrics: We collected weekly sale inventory counts across 15 major US metropolitan statistical areas (MSAs). The evaluation period spans from February 2025 to October 2025. For each prediction task, the models are provided with the preceding 3 years of historical numerical data as context.
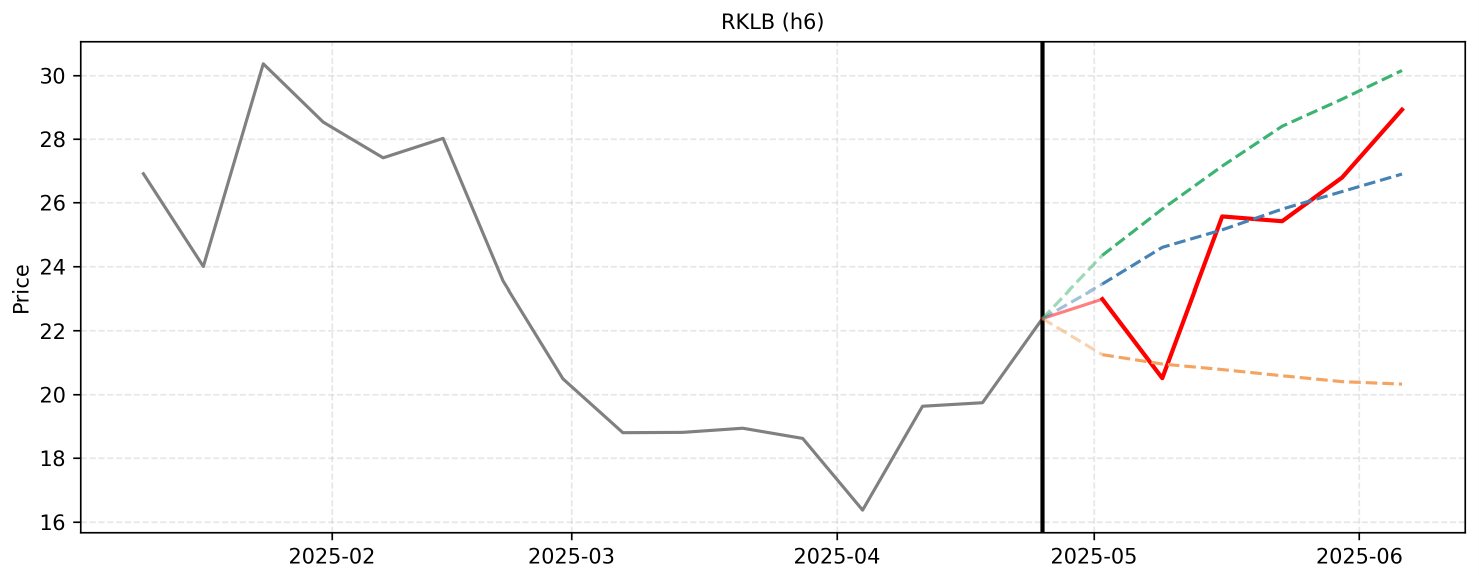
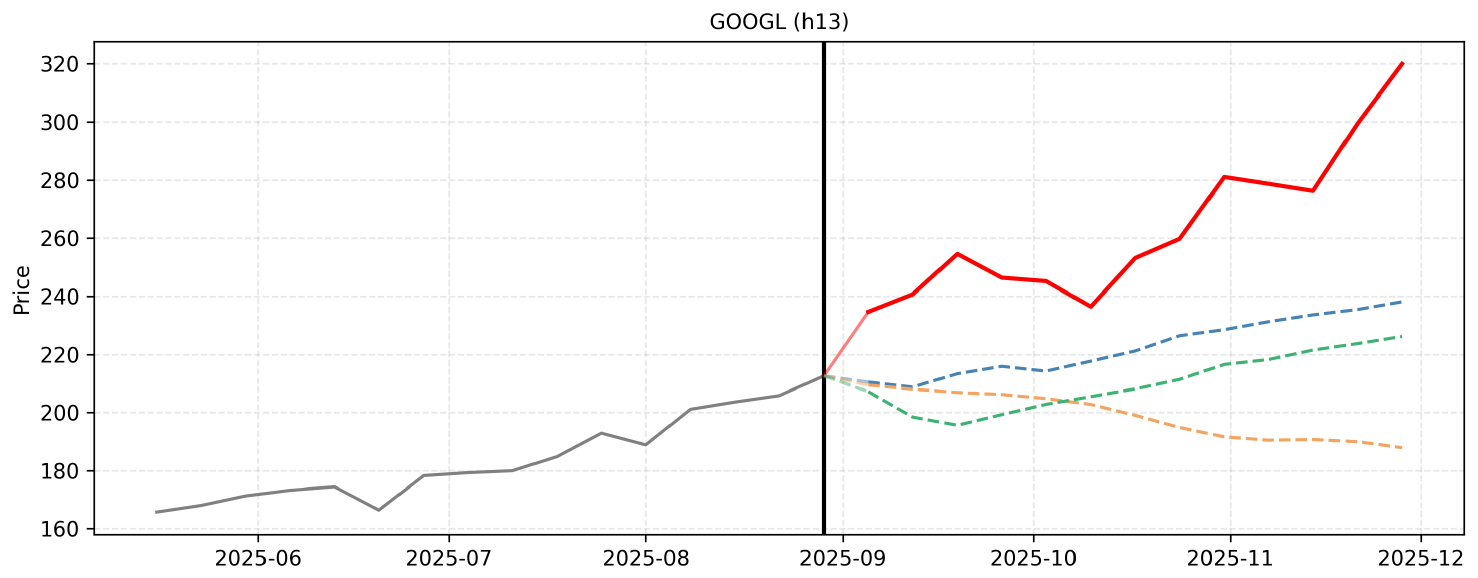
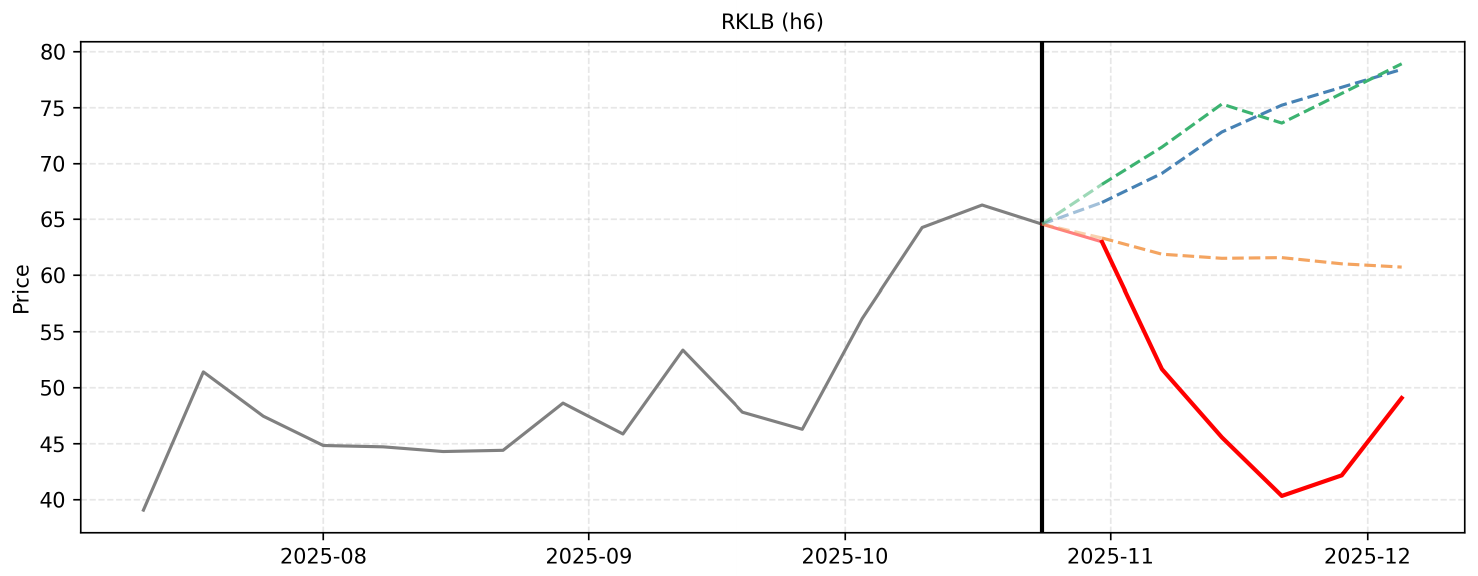
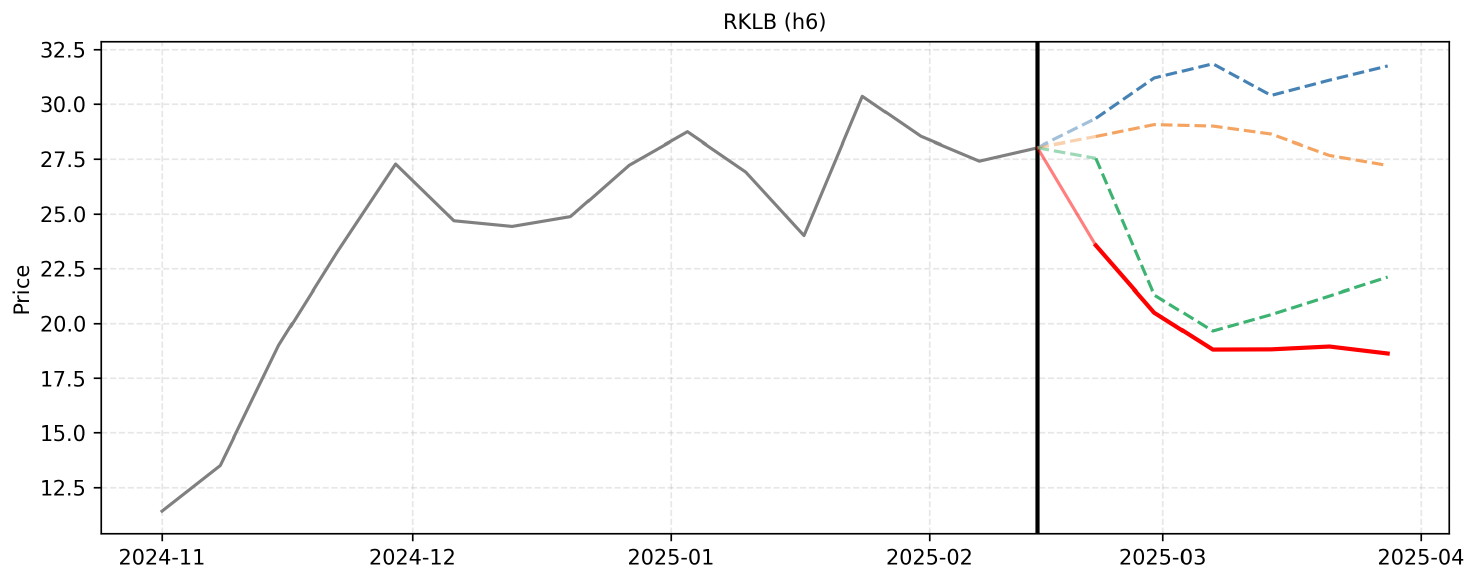
- Stock Market Equities: We curated weekly closing prices for a diverse portfolio of seven publicly traded companies (AAPL, GOOGL, RKLB, JNJ, MSFT, NFLX, NVDA). The evaluation period spans February 2025 through December 2025. Given the higher volatility of equities, the models are provided with 1 year of historical numerical data as context.
A summary of the curated datasets is provided in Table 1.
\begin{tabular}{llcp{6cm}ccccc}
\toprule
\textbf{Dataset} & \textbf{Entity Type} & \textbf{# of Entities} & \textbf{Entities Included} & \textbf{Frequency} & \textbf{Context Length} & \textbf{Horizon} & \textbf{Samples/Entity} & \textbf{Total Samples} \\
\midrule
\multirow{6}{*}{Zillow Home Counts} & \multirow{6}{*}{Cities} & \multirow{6}{*}{15} & \multirow{6}{=}{Atlanta, Boston, Chicago, Detroit, Houston, Los Angeles, Miami, Minneapolis, New York, Philadelphia, Riverside, San Diego, San Francisco, Seattle, Washington D.C.} & \multirow{6}{*}{Weekly} & \multirow{6}{*}{3 Years} & & & \\
 & & & & & & 4 & 34 & 510 \\
 & & & & & & 8 & 30 & 450 \\
 & & & & & & 13 & 25 & 375 \\
 & & & & & & & & \\
 & & & & & & & & \\
\midrule
\multirow{3}{*}{Stock Market Prices} & \multirow{3}{*}{Tickers} & \multirow{3}{*}{7} & \multirow{3}{=}{AAPL, GOOGL, JNJ, MSFT, NFLX, NVDA, RKLB} & \multirow{3}{*}{Weekly} & \multirow{3}{*}{1 Year} & 6 & 42 & 294 \\
 & & & & & & 13 & 35 & 245 \\
 & & & & & & 26 & 22 & 154 \\
\bottomrule
\end{tabular}
Models.
We conduct our experiments using two state-of-the-art foundation models: Gemini-3.1-Pro [22] (maximum supported context length of 1M tokens) and Claude-4.5-Sonnet [23] (maximum context length of 200K tokens). Both models possess a known knowledge cutoff date of January 2025, aligning perfectly with our curated datasets to prevent data leakage. We access these models via Vertex AI, maintaining a sampling temperature of $0.1$ across all experiments to ensure highly deterministic and reproducible outputs (see Appendix B for detailed prompt configurations).
Baselines.
As our primary quantitative baseline, we utilize TimesFM-2.5 [5], a flagship TSFM pre-trained on massive corpora of numerical data. Furthermore, given the lack of existing LLM-based frameworks designed specifically for multimodal contextual prediction, we establish a strong Chain-of-Thought (CoT) baseline. Inspired by zero-shot Time Series Forecasting [25] and zero-shot chain-of-thought [18], the prompts for this strong baseline were independently curated by a graduate researcher with extensive expertise in LLMs and time series forecasting. This baseline feeds the raw historical numerical sequence and the associated textual context directly into the LLM, prompting it to explicitly reason step-by-step before generating its final numerical predictions.
Evaluation Settings & Horizons.
To isolate and quantify the impact of qualitative information on forecasting accuracy, we evaluate the LLMs under two distinct settings: (1)
With Numerical Context Only: The models receive only the raw historical numerical sequence and corresponding timestamps. (2)
With Multimodal Context: The models receive the historical numerical sequence alongside a chronological stream of relevant unstructured text (e.g., macroeconomic summaries or corporate news), following the alignment methodology proposed in TFRBench [26]. We evaluate performance across three distinct forecasting horizons to assess stability over time: short, medium, and long. For the Zillow dataset, these horizons are defined as 4, 8, and 13 weeks. For the more volatile Stocks dataset, the horizons are extended to 6, 13, and 26 weeks. For $\textsc{Nexus}$, we keep the number of backtest splits $n=6$, and the minimum improvement threshold as $5%$ for calibration.
Evaluation Metrics.
We evaluate the forecasting performance using two standard metrics: Mean Absolute Percentage Error (MAPE) and Root Mean Square Error (RMSE). MAPE measures the relative error as a percentage, making it effective for comparing performance across entities with different numerical scales. RMSE measures the absolute magnitude of the error, penalizing larger deviations from the ground truth, which is critical for assessing the stability and reliability of the forecast.
4.2 Forecasting with Multimodal Context
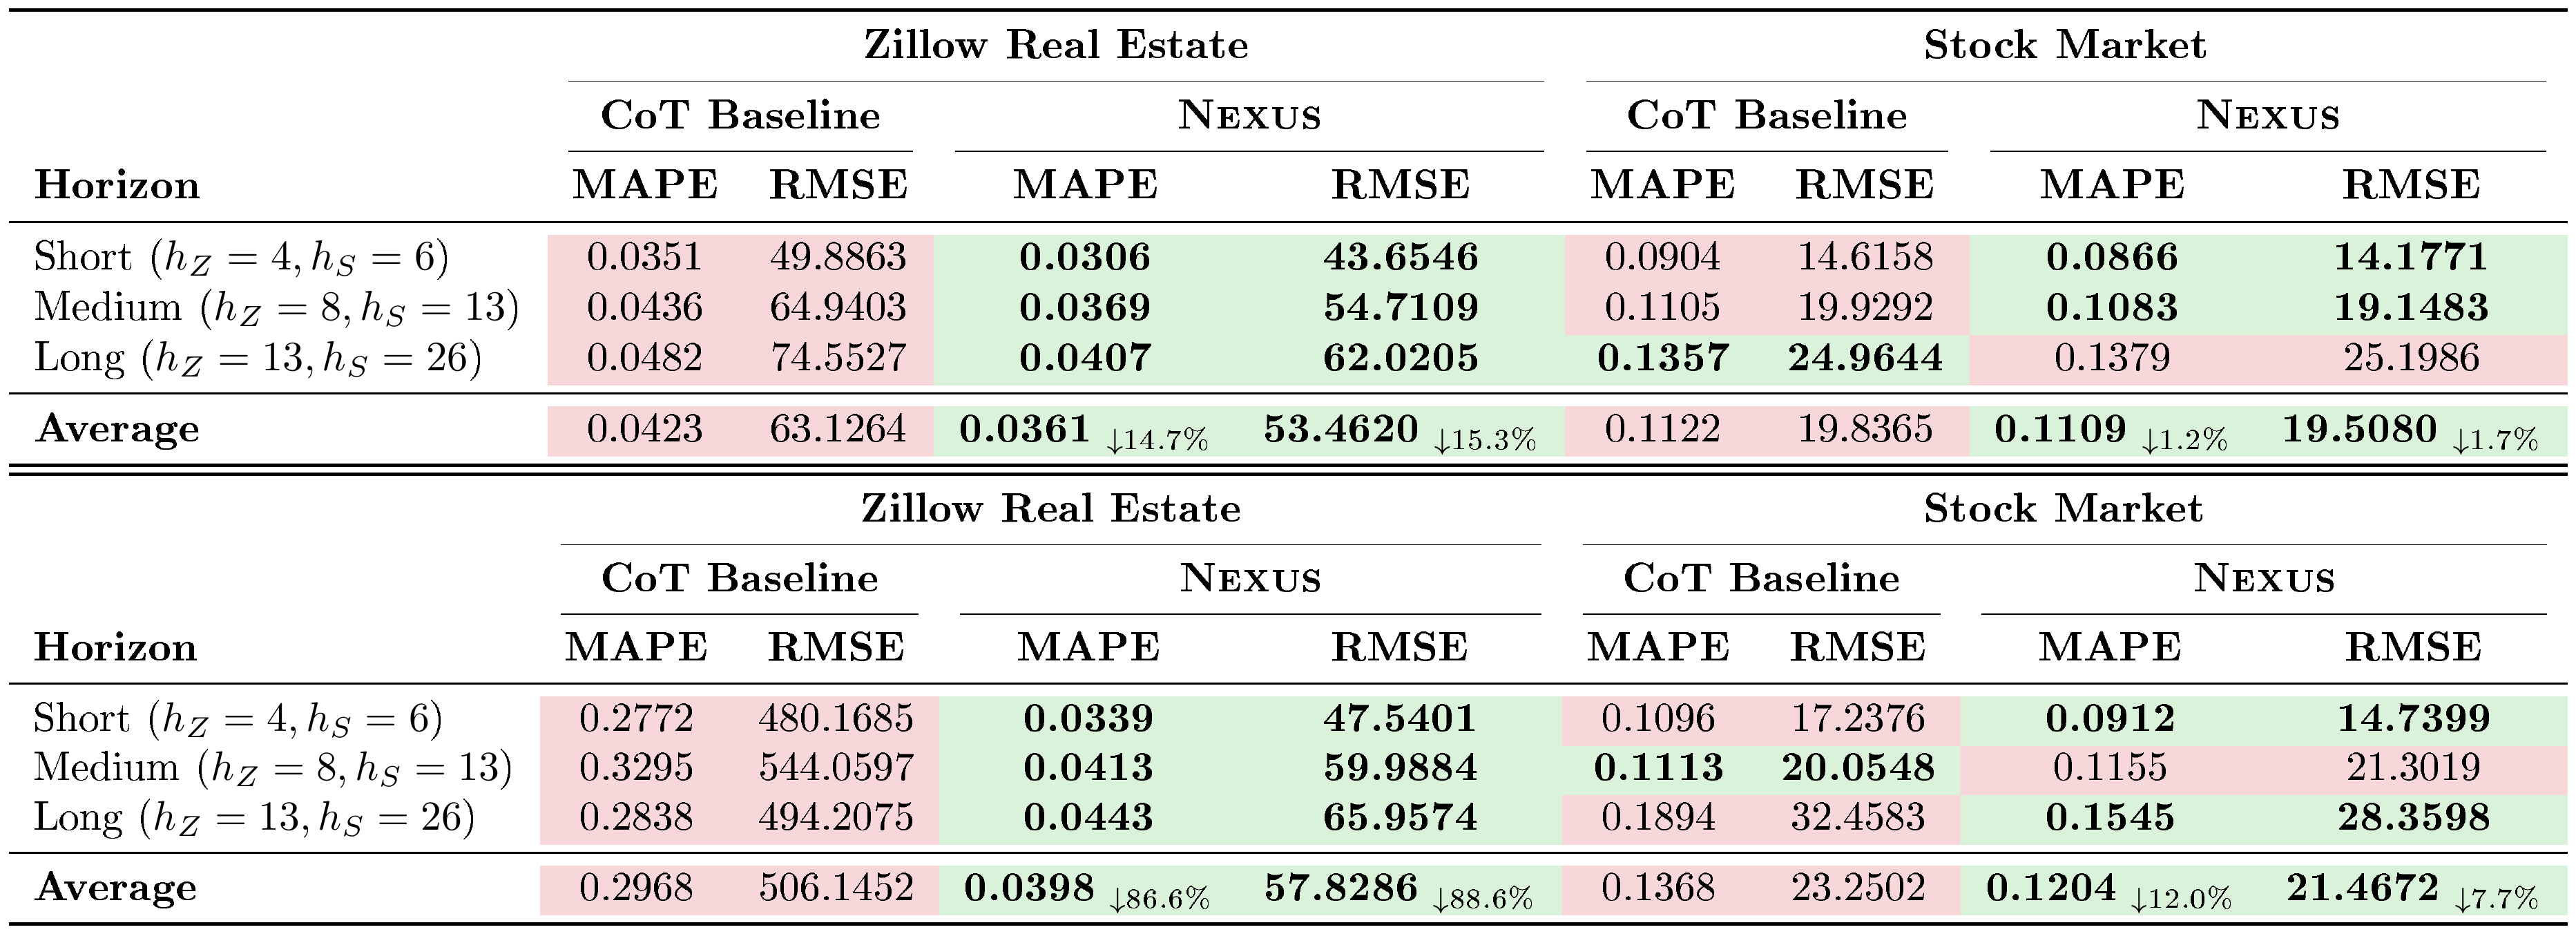
We first evaluate the ability of $\textsc{Nexus}$ to synthesize numerical data with unstructured textual context. We compare the $\textsc{Nexus}$ framework against the strong Chain-of-Thought (CoT) baseline discussed above. For this comparison, we channel historical numerical sequence paired with the chronological stream of relevant text to the corresponding method.
::: {caption="Table 2: Multimodal Contextual Forecasting Performance on Zillow Real Estate and Stock Market Datasets. Lower values indicate better performance. Subscripts in the Average row denote the relative percentage improvement ($\downarrow$) of $\textsc{Nexus }$ compared to the CoT Baseline."}
:::
Table 2 details the multimodal contextual forecasting performance across the Zillow and stock market datasets. These results demonstrate that $\textsc{Nexus}$ consistently outperforms the LLM-based CoT-baseline, highlighting its superior efficacy in multimodal contextual time series forecasting. This performance gap is especially pronounced in the Zillow dataset, which demands a precise grasp of fundamental time series dynamics. Notably, while using Claude-4.5-Sonnet, the CoT-baseline exhibits significant performance degradation. As observed in MRCR-v2 [27], Claude-4.5-Sonnet often struggles with long-context tasks. This limitation likely causes the baseline to over-rely on simple trend extrapolation while failing to leverage the complex, core temporal characteristics required for accurate forecasting, causing massive performance degradation for CoT-baseline. Conversely, Stocks mostly shows a long-term trend, and therefore the impact of incorrect dynamics extraction is minimized. Nevertheless, $\textsc{Nexus}$ maintains robust performance across both domains by effectively tracking both nuanced temporal dynamics and contextual events.
4.3 Forecasting with Numerical Context Only
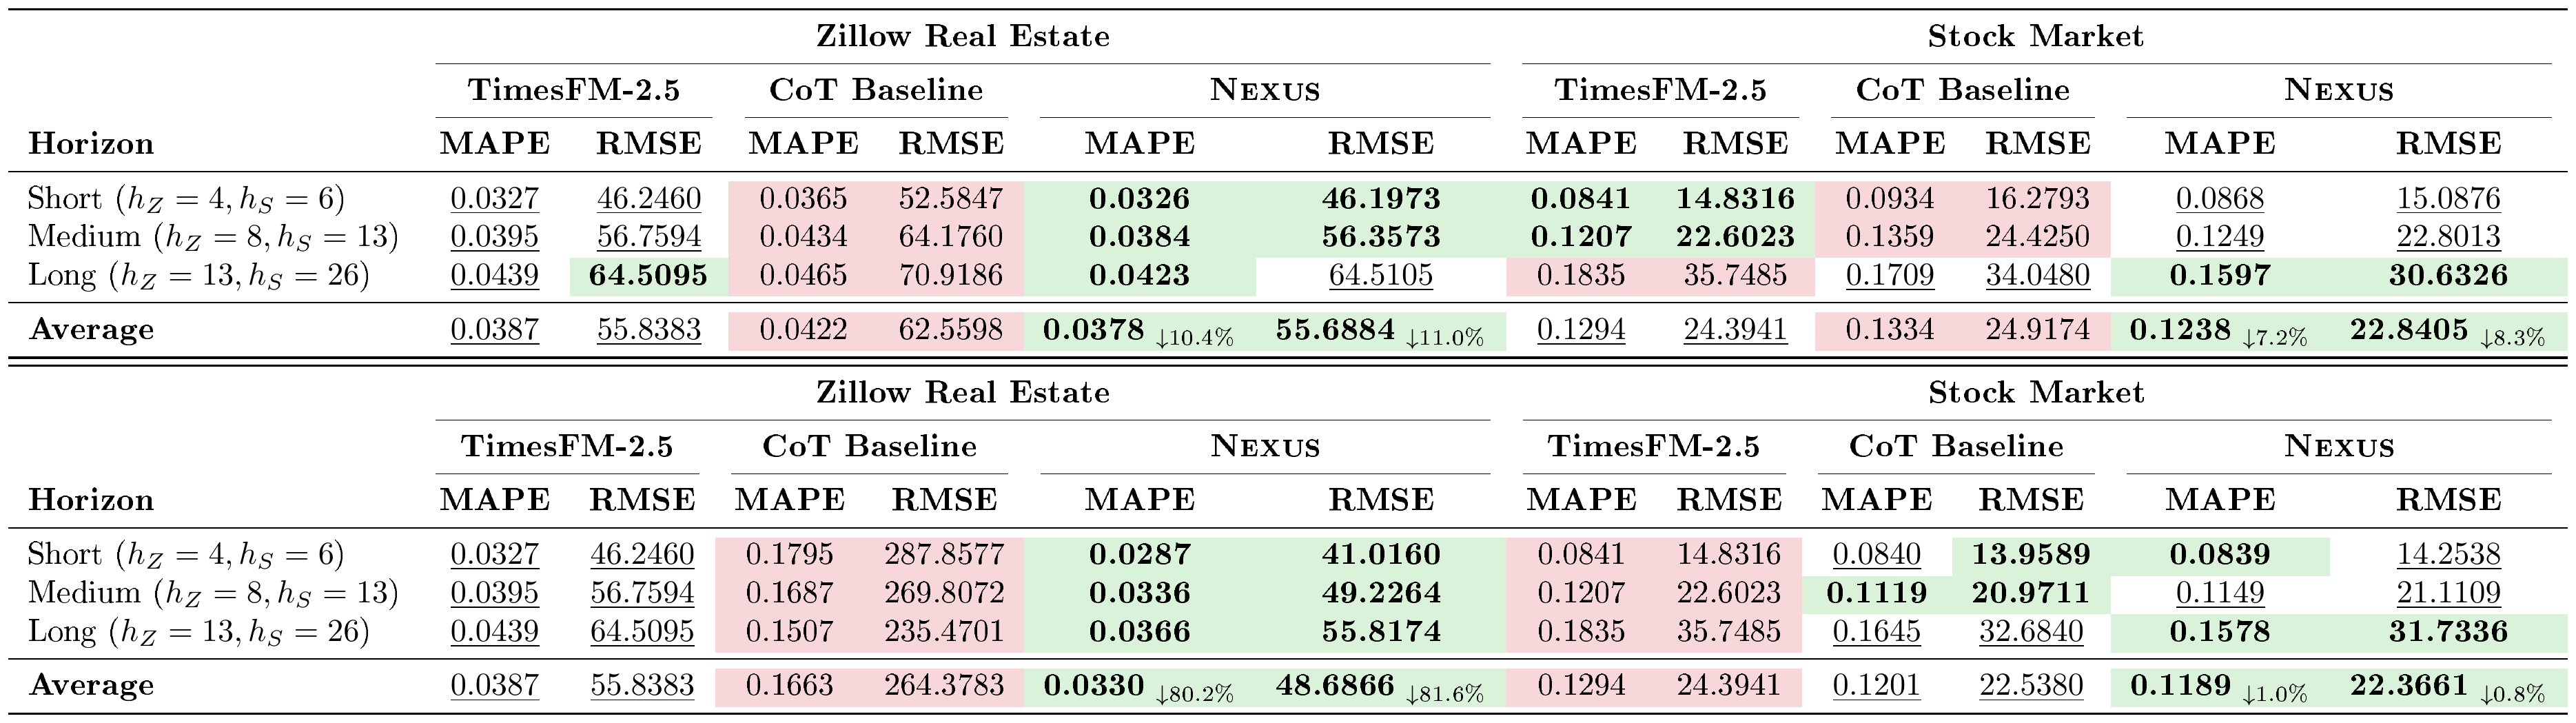
In this section, we evaluate the models' intrinsic time-series pattern-recognition capabilities by providing only the raw historical numerical sequence with associated timestamps. We compare $\textsc{Nexus}$ against the CoT-Baseline and TimesFM-2.5, one of the flagship TSFMs.
Table 3 details the performance across the Zillow and Stocks datasets. $\textsc{Nexus}$ demonstrates strong performance across both domains. More interestingly, we see that $\textsc{Nexus}$ consistently matches or outperforms TSFM performance, showcasing that beyond contextual reasoning, $\textsc{Nexus}$ captures time-series dynamics well.
::: {caption="Table 3: Numerical only Forecast Performance on Zillow Real Estate and Stock Market Datasets. Lower values indicate better performance. Best results are highlighted in green, while worst results are in red. Second-best performance is underlined. Subscripts in the Average row denote the relative percentage improvement ($\downarrow$) of $\textsc{Nexus }$ compared to the CoT Baseline."}
:::
4.4 Reasoning Quality Evaluation
While numerical accuracy (MAPE/RMSE) provides a quantitative measure of forecasting performance, we also want to capture the logical coherence or plausibility of the underlying analysis. To evaluate the qualitative strength of the generated forecasts, we conduct a pairwise comparative evaluation between $\textsc{Nexus}$ and the CoT Baseline.
To eliminate same model-family bias, we employ a cross-judge methodology where the outputs generated by Gemini-3.1-Pro are evaluated by Claude-4.5-Sonnet, and vice versa. The judge model is provided with the ground truth events that occurred during the forecast horizon and the reasoning traces from both $\textsc{Nexus}$ and CoT (we randomize them to prevent position bias). The judge evaluates the reasoning across four criteria:
1) Domain Relevance: Correct utilization of domain-specific terminology and concepts;
2) Event Relevance & Plausibility: The logical and causal linkage between the ground truth events and the predicted fluctuations;
3) Logic-to-Number Consistency: The alignment between the narrative plan and the numerical output;
4) Analytical Depth: The demonstration of a understanding of fundamental time-series dynamics (trend, volatility, momentum). Table 4 presents the detailed breakdown of Win, Tie, and Loss rates for $\textsc{Nexus}$ against the CoT Baseline across both datasets. $\textsc{Nexus}$ provides superior numerical forecast and substantially better reasoning compared to that of CoT and gets preferred by the judge LLMs most of the time.
\begin{tabular}{llcccc}

\toprule

& & \multicolumn{2}{c}{\textbf{Gemini-3.1-Pro}} & \multicolumn{2}{c}{\textbf{Claude-4.5-Sonnet}} \\

\cmidrule(lr){3-4} \cmidrule(lr){5-6}

\textbf{Evaluation Criteria} & \textbf{Metric} & \textbf{Stocks} & \textbf{Zillow} & \textbf{Stocks} & \textbf{Zillow} \\

\midrule

\multirow{3}{*}{\textbf{Domain Relevance}}

& \cellcolor[HTML]{D9F2D9}\textbf{\textsc{Nexus } Win} & \cellcolor[HTML]{D9F2D9}\textbf{37.4\%} & \cellcolor[HTML]{D9F2D9}\textbf{85.8\%} & \cellcolor[HTML]{D9F2D9}\textbf{51.4\%} & \cellcolor[HTML]{D9F2D9}\textbf{73.4\%} \\

& CoT Baseline Win & 16.2\% & 9.2\% & 1.2\% & 11.1\% \\

& Tie & 46.4\% & 5.0\% & 47.4\% & 15.5\% \\

\midrule

\multirow{3}{*}{\textbf{Event Relevance \& Plausibility}}

& \cellcolor[HTML]{D9F2D9}\textbf{\textsc{Nexus } Win} & \cellcolor[HTML]{D9F2D9}\textbf{64.1\%} & \cellcolor[HTML]{D9F2D9}\textbf{96.9\%} & \cellcolor[HTML]{D9F2D9}\textbf{73.2\%} & \cellcolor[HTML]{D9F2D9}\textbf{85.9\%} \\

& CoT Baseline Win & 35.1\% & 1.9\% & 21.6\% & 11.8\% \\

& Tie & 0.8\% & 1.2\% & 5.2\% & 2.3\% \\

\midrule

\multirow{3}{*}{\textbf{Logic-to-Number Consistency}}

& \cellcolor[HTML]{D9F2D9}\textbf{\textsc{Nexus } Win} & \cellcolor[HTML]{D9F2D9}\textbf{61.0\%} & \cellcolor[HTML]{D9F2D9}\textbf{92.7\%} & \cellcolor[HTML]{D9F2D9}\textbf{65.7\%} & \cellcolor[HTML]{D9F2D9}\textbf{63.1\%} \\

& CoT Baseline Win & 33.1\% & 3.8\% & 2.5\% & 1.8\% \\

& Tie & 5.9\% & 3.5\% & 31.8\% & 35.1\% \\

\midrule

\multirow{3}{*}{\textbf{Analytical Depth}}

& \cellcolor[HTML]{D9F2D9}\textbf{\textsc{Nexus } Win} & \cellcolor[HTML]{D9F2D9}\textbf{61.7\%} & \cellcolor[HTML]{D9F2D9}\textbf{97.6\%} & \cellcolor[HTML]{D9F2D9}\textbf{82.7\%} & \cellcolor[HTML]{D9F2D9}\textbf{89.5\%} \\

& CoT Baseline Win & 37.4\% & 2.1\% & 16.0\% & 10.2\% \\

& Tie & 0.9\% & 0.3\% & 1.3\% & 0.3\% \\

\midrule

\multirow{3}{*}{\textbf{Overall Preference}}

& \cellcolor[HTML]{D9F2D9}\textbf{\textsc{Nexus } Win} & \cellcolor[HTML]{D9F2D9}\textbf{63.5\%} & \cellcolor[HTML]{D9F2D9}\textbf{97.1\%} & \cellcolor[HTML]{D9F2D9}\textbf{79.8\%} & \cellcolor[HTML]{D9F2D9}\textbf{88.5\%} \\

& CoT Baseline Win & 35.7\% & 2.8\% & 19.9\% & 11.5\% \\

& Tie & 0.8\% & 0.1\% & 0.3\% & 0.0\% \\

\bottomrule

\end{tabular}
\begin{tabular}{lcccc}
\toprule
& \multicolumn{2}{c}{\textbf{Zillow Real Estate}} & \multicolumn{2}{c}{\textbf{Stock Market}} \\
\cmidrule(lr){2-3} \cmidrule(lr){4-5}
\textbf{Model} & \textbf{MAPE} & \textbf{RMSE} & \textbf{MAPE} & \textbf{RMSE} \\
\midrule
\textsc{Nexus } (w/o Micro Reasoning) & 0.0314 & 44.2729 & 0.0877 & 14.2639 \\
\textsc{Nexus } (w/o Macro Reasoning) & 0.0317 & 44.5692 & 0.0882 & 14.2941 \\
\textsc{Nexus } (w/o Calibration) & 0.0309 & 43.9299 & 0.0877 & 14.2212 \\
\textsc{Nexus } (Full Pipeline) & \cellcolor[HTML]{D9F2D9}\textbf{0.0306} & \cellcolor[HTML]{D9F2D9}\textbf{43.6546} & \cellcolor[HTML]{D9F2D9}\textbf{0.0866} & \cellcolor[HTML]{D9F2D9}\textbf{14.1771} \\
\bottomrule
\end{tabular}
4.5 Component Analysis
In order to quantify the impacts of the different agents in our framework, Table 5 presents the results of component analysis using Gemini-3.1-Pro under the multimodal contextual setting for the short-term forecasting horizon ($h_Z=4, h_S=6$). We compare the full $\textsc{Nexus}$ pipeline against variants where (i) Micro Reasoning Agent, (ii) Macro Reasoning Agent, or (iii) Calibration Agent is disabled.
The results demonstrate that macro, micro, and calibration - all components are critical for achieving optimal forecasting accuracy. On the Stock Market dataset, removing the Micro Reasoning agent increases the MAPE from 0.0866 to 0.0877, indicating that granular, step-by-step analysis is essential for capturing short-term volatility. Conversely, removing the Macro Reasoning agent increases the MAPE to 0.0882, highlighting the importance of overarching trend guidance. The full $\textsc{Nexus}$ pipeline, which synthesizes both Macro and Micro perspectives, consistently outperforms the ablated variants and the standard CoT, confirming the efficacy of the full architecture of $\textsc{Nexus}$.
5. Related Works
Section Summary: Recent research has explored whether large language models, originally built for text, can be adapted for predicting numerical time series data, either by directly feeding in numbers as text tokens or by aligning them with pretrained models like GPT. At the same time, specialized foundation models such as Chronos and TimesFM have been trained from scratch on massive collections of time series, turning forecasts into a form of probabilistic language modeling without relying on text. A newer direction treats these models as reasoning agents that can plan, reflect, and iteratively refine predictions using external tools or feedback rather than producing one-shot outputs.
LLMs for Time Series Forecasting.
Recent work has started to explore whether large language models (LLMs), originally trained on discrete text, can be adapted to continuous time series forecasting. Surveys of this area identify several major directions, including direct prompting, numerical tokenization, modality alignment, cross-modal bridging, etc. [28] [25] shows that by encoding numerical observations as strings and formulating forecasting as next-token prediction, LLMs can perform zero-shot extrapolation in some settings. On the other hand, pretrained transformers have also been researched for time series forecasting through lightweight modality alignment. GPT4TS/FPT [10] demonstrates that frozen pretrained language or vision transformers can be transferred to time series analysis with limited parameter updates, while TEMPO [29] incorporates time-series inductive biases such as STL decomposition and prompt-based distribution adaptation. Time-LLM [30] further reprograms time-series patches into text-prototype representations and uses prompt-as-prefix conditioning to guide frozen LLM backbones. UniTime [12] extends this direction to cross-domain multivariate forecasting. However, the utility of LLM backbones for time series remains contested. [13] show through systematic ablations of several LLM-based forecasting methods that removing or replacing the LLM component often does not degrade performance, suggesting that much of the gain may come from patching, attention, or task-specific adaptation rather than linguistic pretraining itself.
Time-Series Foundation Models.
Another line treats forecasting more explicitly as language modeling by discretizing numerical observations. Chronos [8] scales and quantizes continuous time-series values into a fixed vocabulary and trains transformer language-model architectures with cross-entropy loss, enabling probabilistic zero-shot forecasting across diverse datasets. In contrast to methods that reuse language models, these time-series foundation models avoid the text-modality gap by pretraining transformer architectures directly only on large temporal corpora. TimesFM [5] uses a patched decoder-only architecture for zero-shot forecasting across varying horizons and granularities. Lag-Llama [31] develops a decoder-only probabilistic forecaster using lag covariates; MOMENT [6] learns general-purpose time-series representations through masked reconstruction over the Time-series Pile. MOIRAI [7] introduces cross-frequency, any-variate, and mixture-distribution modeling for universal forecasting. These models demonstrate the promise of large-scale temporal pretraining, but they generally remain static, single-pass predictors that produce forecasts without explicit reasoning, revision, or interaction with external evidence.
Semantic, Adaptive, and Agentic Forecasting.
Recently, researchers have started to explore LLMs not only as sequence models, but also as semantic, adaptive, and agentic forecasting components. LoFT-LLM [32], T-LLM [33], and TimeSAF [34] study semantic calibration, temporal distillation, and asynchronous text-time-series fusion. In parallel, adaptive and agentic forecasting methods move beyond static prediction: Synapse [19] arbitrates among multiple time-series foundation models, whereas TimeCopilot [20] coordinates feature analysis and model selection, and TimeSeriesScientist [35], AlphaCast [36], and Cast-R1 [21] introduce multi-step planning, tool use, reflection, or memory. Most of these recent adaptive and agentic forecasting systems primarily operate over numerical histories, statistical diagnostics, model outputs, or tool-generated features. Finally, agentic time series forecasting [14] argues that forecasting should move beyond static model-centric prediction toward iterative workflows involving perception, planning, reflection, and memory. $\textsc{Nexus}$ is positioned within this emerging direction: rather than relying solely on one-shot numerical extrapolation, LLM-based forecasting systems can benefit from explicit reasoning from state-of-the-art LLMs, diagnostic feedback, and iterative calibration over prior temporal evidence.
6. Conclusion
Section Summary: The paper presents Nexus, a new multi-agent system that breaks down complex forecasting tasks into clear stages to combine large-scale numerical trends with relevant text-based context such as news or events. This staged approach allows the system to generate accurate predictions while also explaining the reasoning behind them, making it more useful for real-world applications like real estate or stock market analysis. Evaluations showed that Nexus outperformed leading time-series models and other AI methods, pointing to a more interpretable and flexible way to handle forecasting that mixes numbers and qualitative information.
In this paper, we introduced $\textsc{Nexus}$, a novel multi-agent framework designed to tackle the complex challenge of multimodal contextual time-series forecasting. By decomposing forecasting into structured stages-Contextualization, Dual-Resolution Forecast Outlook Generation, and Forecast Synthesis and Calibration- $\textsc{Nexus}$ helps manage the complexity of processing long sequences of numerical data combined with unstructured text. $\textsc{Nexus}$ dynamically synthesizes broad macro-level trajectories with granular, event-driven micro-level catalysts, producing highly accurate numerical predictions alongside explicit reasoning. Through rigorous zero-shot evaluations on real-world Zillow real estate and Stock market datasets, we demonstrated that $\textsc{Nexus}$ consistently outperforms both time-series foundation model (TimesFM-2.5) and strong Chain-of-Thought LLM baselines. By bridging the gap between numerical trends and qualitative context, $\textsc{Nexus}$ offers a promising approach for developing interpretable, robust, and highly adaptable forecasting systems for complex, real-world domains.
Appendix
Section Summary: The appendix begins by outlining key limitations of the Nexus evaluation, including its restriction to just the Zillow and Stock datasets due to the scarcity of suitable public data, the high risk of model data leakage addressed by testing only on information after the models’ January 2025 cutoff, and the reliance on single-run results because repeated large-scale model queries are too costly. It then supplies the complete system prompts and user templates for each agent in the framework, such as the Historical Context Agent, the Macro- and Micro-Reasoning Forecaster Agents, and the Calibration Agent. These prompts detail the exact instructions, output formats, and reasoning steps each specialized agent follows when processing historical time-series data and generating forecasts.
A. Limitations
While $\textsc{Nexus}$ demonstrates strong performance across both highly volatile and relatively seasonal scenarios, our evaluation is currently limited to the Zillow and Stock datasets. This scope is primarily constrained by the scarcity of publicly available datasets that provide paired, timestamped numerical values alongside their related textual context. Furthermore, because large language models have already been trained on most of the publicly available data [37], the risk of direct or indirect data leakage is highly probable. To ensure a robust evaluation and mitigate this risk of leakage, we specifically selected two high-performing, popular foundation models with a known knowledge cutoff date of January 2025, and conducted all our experiments strictly on data occurring after this cutoff. Finally, while running our multi-agent system multiple times to establish statistical variance would be ideal, each agent invocation requires querying models with hundreds of billions of parameters. This makes repeated runs not only very expensive but also computationally infeasible. Therefore, the results reported in this study represent single-run evaluations across the datasets.
B. $\textsc{Nexus}$: Agent Prompts
We provide the system prompts and user templates used for each agent in the $\textsc{Nexus}$ framework.
B.1 Historical Context Agent
**System Prompt:**

```
You are an expert causal analysis agent. Your goal is to identify key events from historical text and analyze how they historically impacted the target variable. Your knowledge cutoff date is January 2025.

```

**User Template:**

```
**Task:**
Read the historical data, extract the key explicit and implicit factors, and explain how they historically impacted the values of the target variable "{target_name}".

**Basic Time Series Features**
ts_features

**Domain:** domain

**Historical Data (Text & Values):**
history_str

**Output:**
You must output a structured timeline that chronologically tracks the values and the events that drove them.
For each timestamp, output exactly in this format:

Date/Timestamp: [Date]
Value: [Value]
Textual Content: [A concise, organized summary covering ALL events and factors that influenced the value change]

You must explicitly make sure that you DO NOT miss any single fact, event, or detail listed under any single timestamp/date in the provided history. Ensure the "Textual Content" is well-organized and covers all relevant information from the raw history.

```
B.2 Macro-Reasoning Forecaster Agent
**System Prompt:**

```
You are a contextual numerical forecasting agent. Your task is to predict future values based on the provided historical context. Your knowledge cutoff date is January 2025.

```

**User Template:**

```
**Task:**
Predict the next horizon values for the target variable "{target_name}" using the provided historical context.

**Historical Context:**
history_str

**Instructions:**
First, carefully think step by step. Provide your chain of thought that explicitly breaks down your reasoning across the horizon future steps.

Put this exhaustive, full step-by-step reasoning inside <reasoning> tags.
Then, based on that reasoning, output the final predicted numerical values as an array inside <forecasted_values> tags. You must predict exactly horizon values.

**Output Format:**
<reasoning>
[Full step by step reasoning here in full detail breaking down the reasoning over future time steps in the horizon]
</reasoning>
<forecasted_values>
[10.5, 11.2, 12.1, ...]
</forecasted_values>

```
B.3 Micro-Reasoning Forecaster Agent
**System Prompt:**

```
You are a forecasting agent. Your goal is to predict future events/factors and target values based on the provided historical context. Your knowledge cutoff date is January 2025.

```

**User Template:**

```
**Task:**
Predict the next horizon values and events for the target variable "{target_name}".

**Context:**
- Forecast Horizon: horizon steps at a step size of "{frequency}" each step
- Step Size / Frequency: frequency

**Historical Data:**
history_str

**Required Output Format:**
You must return a single valid JSON object containing a "timestamp_forecasts" list.
The keys must match exactly, and you must generate forecast for every timestamp at frequency of horizon steps.

{{
  "timestamp_forecasts": [
    {{
      "timestamp": 1,
      "date": "YYYY-MM-DD (Day of Week) (or similar format to that of historical dates)",
      "day_info": "factor or event...",
      "reasoning": "movement_label": "Up / Down / Stable",
        "key_drivers": "Concise explanation of the primary factor driving this value.",
      "adjusted_forecast_value": 123.45 // The FINAL predicted value
    }},
    // ... Repeat exactly for horizon steps ...
  ]
}}

```
B.4 Calibration Agent
**System Prompt:**

```
You are a Forecasting Strategy Optimizer. Your goal is to analyze past predictions against actual ground truth and generate specific "Review Guidelines" for a Sanity Check Agent to enforce in future predictions.

```

**User Template:**

```
**Task:**
Critique the Value Predictor Agent's reasoning and numerical predictions against the Ground Truth. Focus primarily on how it translated its reasoning into actual numerical values (e.g., did it overestimate/underestimate impacts?).

**1. Agent's Prompt:**
value_predictor_prompt

**2. Agent's Output:**
Reasoning: agent_reasoning
Predicted Values: agent_values
Error (MAPE): agent_error

**3. Upstream Performance (For Context):**
Macro-Reasoning MAPE: macro_mape
Micro-Reasoning MAPE: micro_mape

**4. Ground Truth:**
Events: actual_events_summary
Values: actual_values

**Output Format:**
1. <diagnosis>: A brief critique of the agent's numerical calibration and logical flaws.
2. <guidelines>: A single, short paragraph of robust advice for future predictions to fix these numerical estimation errors. Make sure the guidelines are generalized rather than too specific which may not apply to future scenarios.

```
B.5 Value Predictor Agent
**System Prompt:**

```
You are a forecasting agent. Your task is to predict future values based on the provided historical context. For reference, you have access to forecasts from high-level macro reasoning and granular micro reasoning which you can utilize for final forecast. Your knowledge cutoff date is January 2025.

```

**User Template:**

```
**Task:**
Predict the final numerical value of **target_name** for the next horizon steps. You are provided with a Macro-Reasoning outlook and a Micro-Reasoning step-by-step breakdown. Think and reason very carefully for giving the final output.

**Context:**
- Forecast Horizon: horizon steps at a step size of "{frequency}"
- Step Size / Frequency: frequency
- Required Future Dates: future_dates

**Inputs:**
1. Historical Data:
history_str
event_predictions_section
2. Macro-Reasoning Outlook (Overarching Logic & Values):
macro_reasoning_str

3. Micro-Reasoning Breakdown (Step-by-Step Events & Values):
micro_reasoning_str
guidelines_section
**Instructions:**
First, carefully think step by step. You MUST provide step-by-step chain of thought that explicitly breaks down your reasoning for each of the horizon future steps. Explain how you adjusted the Macro and Micro perspectives to arrive at your final value.

Put this exhaustive, full step-by-step reasoning inside <reasoning> tags.
Then, based on that reasoning, output the final predicted numerical values as an array inside <forecasted_values> tags. You must predict exactly horizon values.

**Output Format:**
<reasoning>
[Full step by step reasoning here in full detail breaking down the reasoning over future time steps in the horizon]
</reasoning>
<forecasted_values>
[10.5, 11.2, 12.1, ...]
</forecasted_values>

```
C. CoT-Baseline Prompt
In this section, we provide the system prompt and user template used for the Chain-of-Thought (CoT) baseline model.
**System Prompt:**

```
You are a contextual numerical forecasting agent. Your task is to predict future values based on the provided historical context. You have to solely rely on your own deductive reasoning based on the provided context. Your knowledge cutoff date is January 2025.

```

**User Template:**

```
**Target Metric:** target_name
**Target Location:** domain
**Forecast Time (Cut-off):** last_date
**Prediction Horizon:** Next horizon steps (frequency Forecast)

**A. Historical Records (start_date to last_date)**
history_values_str

**B. Event Intelligence**
history_text_str

(Note: Consider how the events listed above interact with the typical seasonality of the target_name.)

**TASK:**
Predict the future frequency values for target_name for the next horizon steps based on the historical data and event intelligence above.
Since you are generating an frequency forecast, you MUST output EXACTLY horizon data points.

**STRICT CONSTRAINTS:**
1. **BRIEF ANALYSIS:** Provide a reasoning to explain your prediction.
2. **FORMAT:** Comma-separated values ONLY for the numerical array.
3. **WRAPPER:** Wrap the final sequence of forecasting numbers strictly inside `<prediction>` tags.

**Output Format:**
[Your reasoning here]
<prediction>val1, val2, val3, ..., valN</prediction>

```
D. LLM-as-a-Judge Prompt
We provide the system prompt and user template used for the LLM-as-a-Judge reasoning comparator. This agent evaluates the qualitative strength of the generated forecasts by comparing the reasoning traces of two models.
**System Prompt:**

```
You are an expert financial and time-series forecasting judge. Your task is to compare the reasoning quality of two different forecasting models and determine which one is better.

You will be provided with:
1. GROUND TRUTH EVENTS: The actual events that occurred during the forecast horizon.
2. MODEL A REASONING & PREDICTIONS: The reasoning text and numerical predictions from Model A.
3. MODEL B REASONING & PREDICTIONS: The reasoning text and numerical predictions from Model B.

Note: You will NOT be provided with the actual ground truth numerical values. Your job is to evaluate the *quality, coherence, and plausibility* of the reasoning itself, regardless of whether the final prediction was perfectly accurate.

You must evaluate both models based on the following criteria:
1. Domain Relevance: Correct use of domain-specific terminology (e.g., 'support levels', 'seasonality', 'macroeconomic headwinds').
2. Event Relevance & Plausibility: Does the reasoning logically and causally link the provided Ground Truth Events to its predicted fluctuations? Is the narrative highly plausible given the events? (Penalize hallucinations or illogical connections).
3. Logic-to-Number Consistency: Does the narrative plan align with the model's *own* numerical output? If the reasoning predicts a "sharp drop" or "modest pullback", do the predicted numbers actually reflect that magnitude and direction?
4. Analytical Depth: Does the reasoning demonstrate a deep understanding of fundamental time-series dynamics (trend, volatility, momentum) rather than just superficial observations?

Compare Model A and Model B. Decide which model provides better reasoning overall based purely on logical coherence, depth, and plausibility. If they are equally good or equally bad, you can declare a Tie.

You must output your evaluation strictly as a JSON object matching the following schema exactly:
  "domain_relevance_winner": "<Model A, Model B, or Tie>",
  "event_relevance_winner": "<Model A, Model B, or Tie>",
  "logic_to_number_winner": "<Model A, Model B, or Tie>",
  "analytical_depth_winner": "<Model A, Model B, or Tie>",
  "overall_preference": "<Model A, Model B, or Tie>",
  "justification": "<2-4 sentence explanation of why the preferred model is better overall, referencing specific criteria>"

Do not include any markdown formatting (like ```json) in your output. Output ONLY the raw JSON object.

```

**User Template:**

```
--- GROUND TRUTH EVENTS ---
ground_truth_events

--- MODEL A REASONING ---
model_a_reasoning

--- MODEL A PREDICTED VALUES ---
model_a_predicted_values

--- MODEL B REASONING ---
model_b_reasoning

--- MODEL B PREDICTED VALUES ---
model_b_predicted_values

Evaluate the reasoning of both models and output the strict JSON object with your preference.

```
E. Qualitative Forecast Examples
F. Qualitative Reasoning Examples
F.1 Example 1
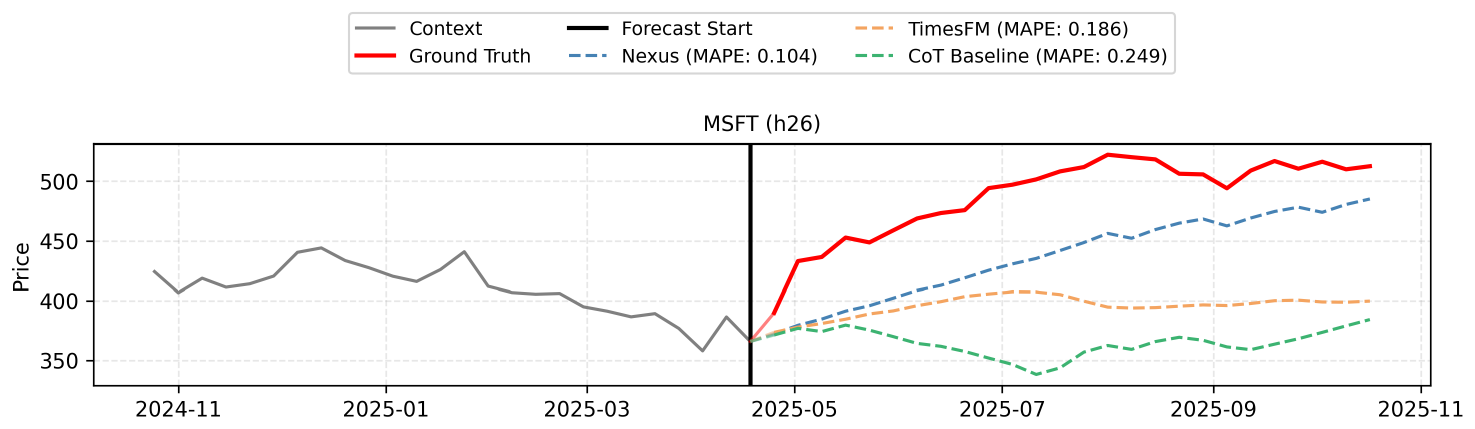
The forecast integrates the macro-level expectation of a gradual recovery from early 2025 tariff shocks with the micro-level catalysts of Microsoft's AI monetization and cloud infrastructure growth. Over the 26-week horizon, the price is projected to steadily climb as the market absorbs trade policy impacts and anticipates strong earnings, despite minor seasonal pullbacks. The final values reflect this consistent upward trajectory driven by enterprise software resilience and ongoing AI advancements.
F.2 Example 2
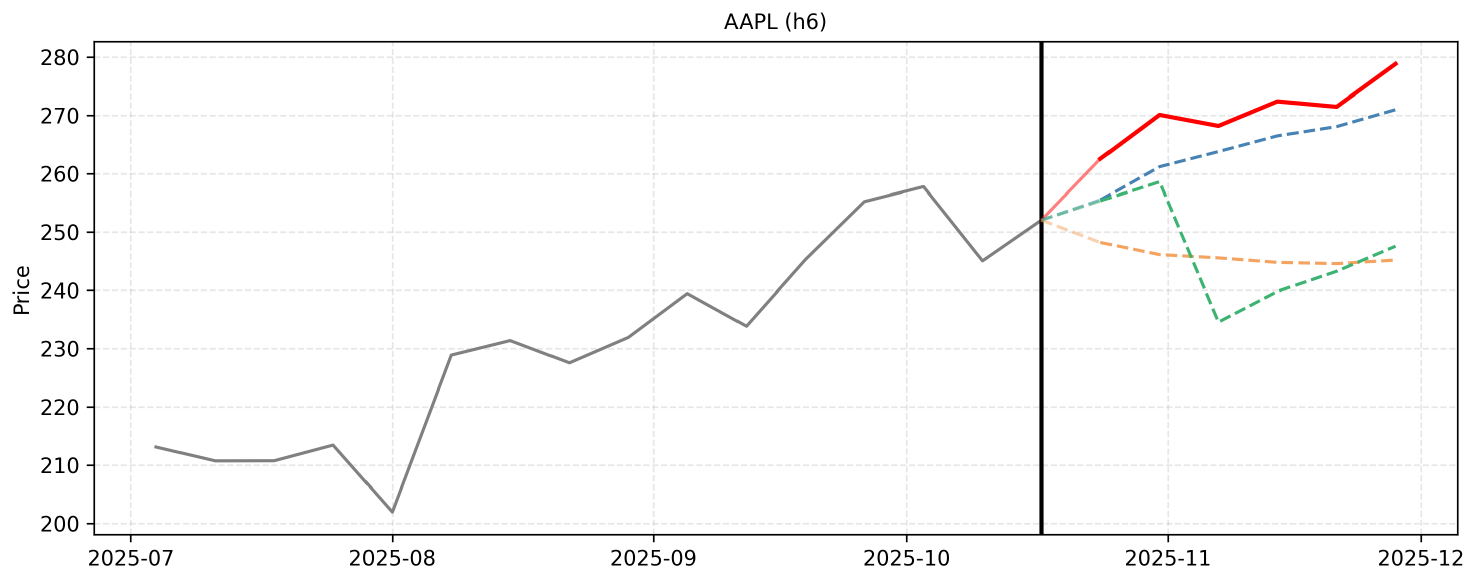
The forecast relies on the strong initial sales of the iPhone 17 and the M5 hardware launch, which provide a solid foundation for continued growth. Upcoming Q4 earnings and a potential Federal Reserve rate cut are expected to act as positive catalysts, outweighing the temporary macroeconomic uncertainty caused by the government shutdown. As the holiday shopping season approaches, robust consumer demand and Black Friday momentum are anticipated to drive the stock steadily higher through late November.
F.3 Example 3
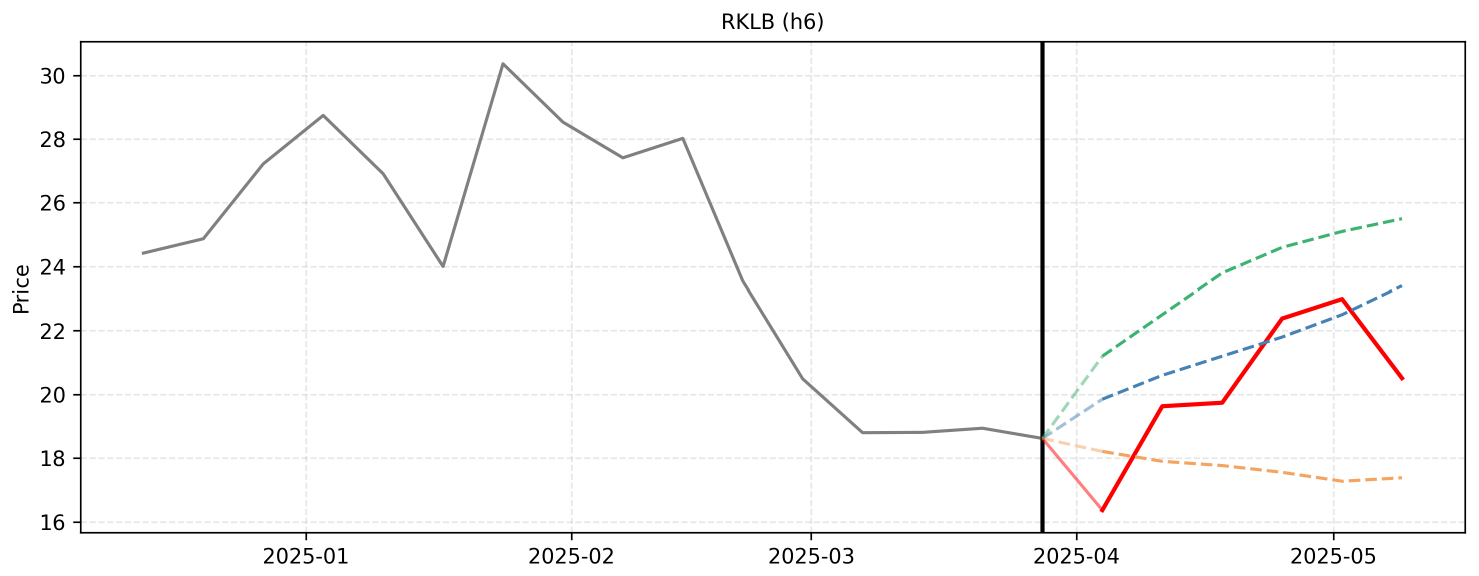
The recent inclusion of Rocket Lab in the \$5.6 billion NSSL Phase 3 Lane 1 contract serves as a major positive catalyst, countering previous short-seller claims and validating the Neutron program. Over the next six weeks, steady upward momentum is expected as the market digests this contract, factors in the strong Q1 launch cadence, and builds anticipation for the upcoming Q1 2025 earnings report. The forecast reflects a gradual recovery trajectory from the recent price correction, aligning the macro validation with micro-level earnings momentum.
F.4 Example 4
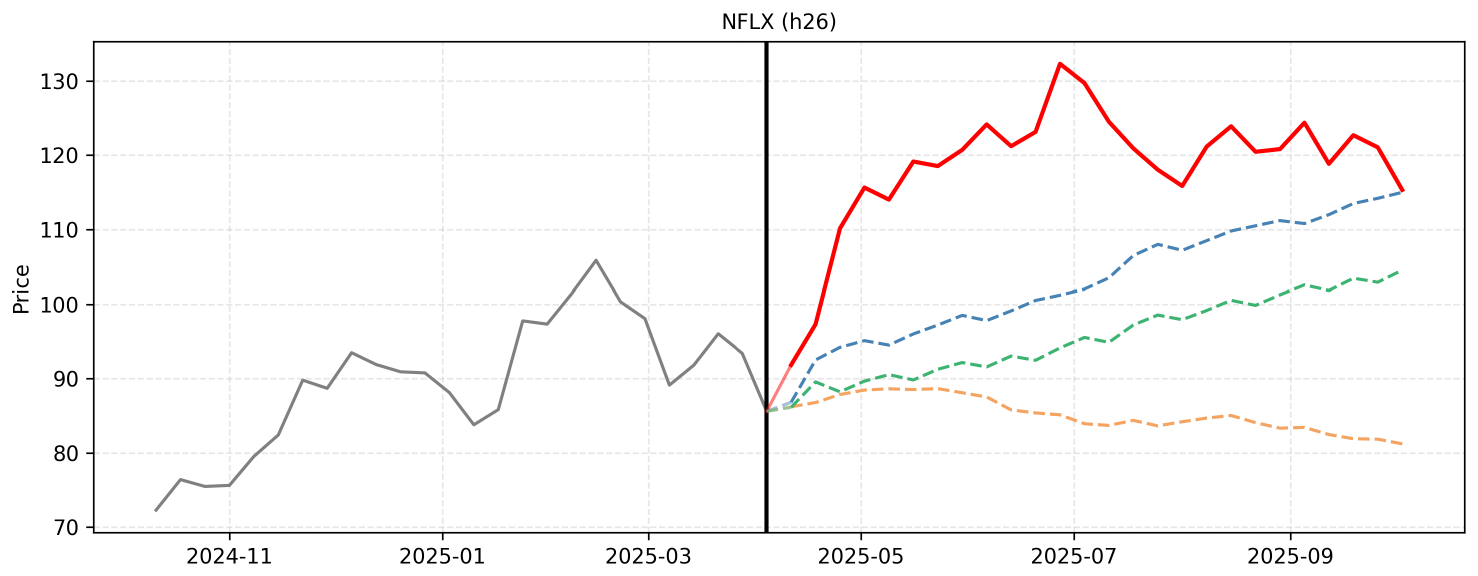
The forecast integrates both macro and micro perspectives, recognizing Netflix's strong underlying fundamentals, including robust ad-tier growth and strategic live sports investments, despite recent macroeconomic volatility. Over the next 26 weeks, the price is expected to recover from recent tariff-induced dips and follow a steady upward trajectory. This growth will be catalyzed by anticipated strong Q1 and Q2 earnings reports, successful summer content slates, and expanding ad-tech capabilities, leading to a projected rise toward the 115 range by October 2025.
F.5 Example 5
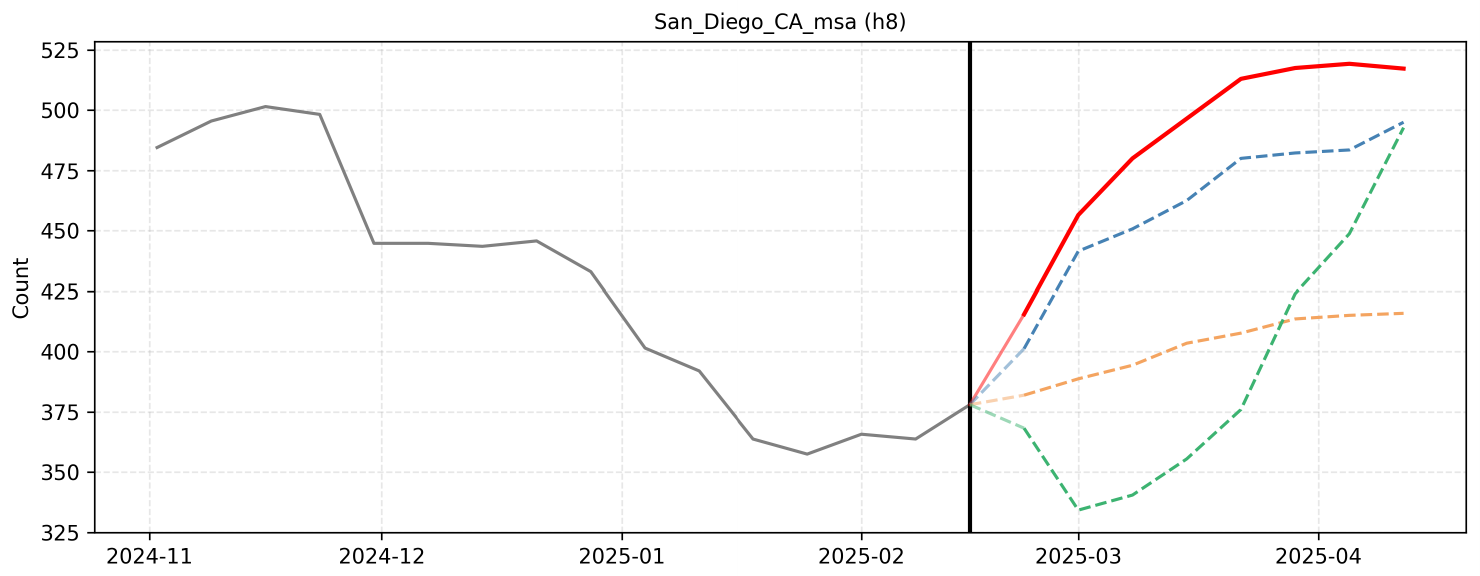
The forecast integrates the macro-level seasonal upward trend observed historically from late February through mid-April with the micro-level event drivers specific to San Diego. By applying historical spring growth rates to the lower 2025 baseline, the predictions account for the steady week-over-week climb driven by spring break travel, cultural festivals, and the start of the baseball season. The final values align with the provided micro-reasoning projections to accurately reflect this anticipated seasonal momentum.
F.6 Example 6
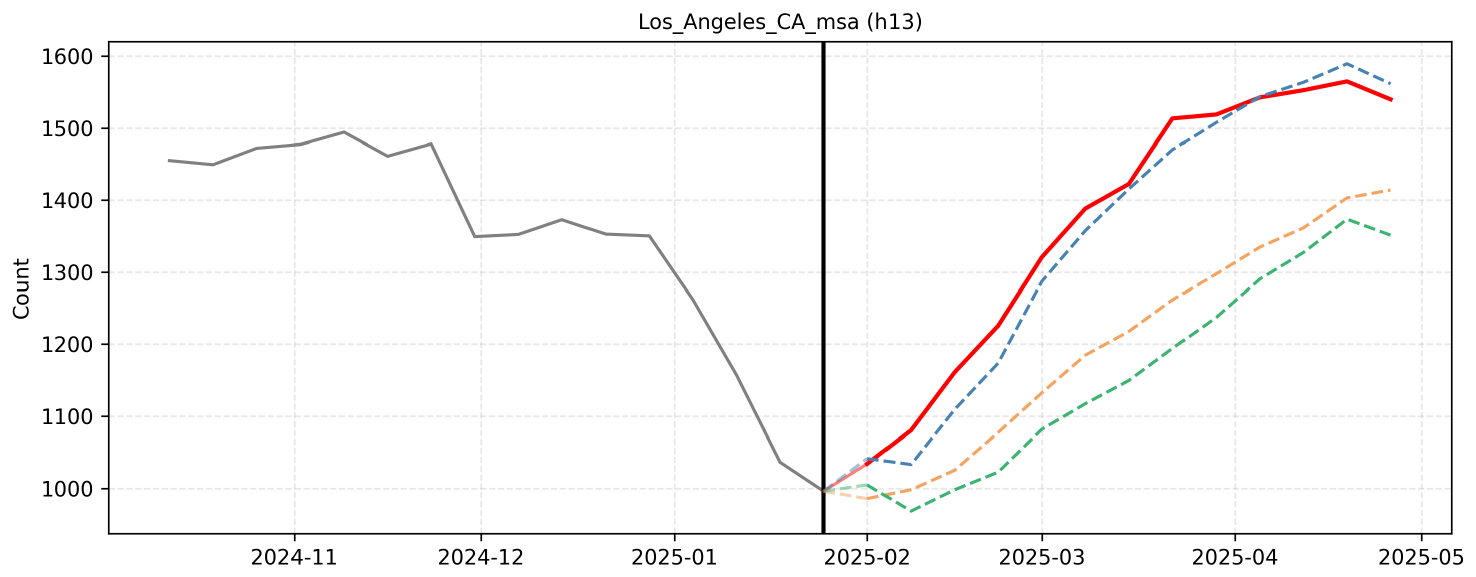
The forecast relies on the historical seasonal pattern where the target variable reaches its lowest points in January and February before steadily climbing through the spring months. I integrated the Macro-Reasoning outlook, which anticipates a recovery from the recent winter and wildfire-induced trough, with the Micro-Reasoning breakdown that accounts for specific upcoming events like the Super Bowl, Academy Awards, LA Marathon, and Coachella. By aligning these perspectives, the projected values reflect a brief stabilization in early February followed by a consistent upward trajectory peaking in mid-April before a slight post-holiday normalization.
F.7 Example 7
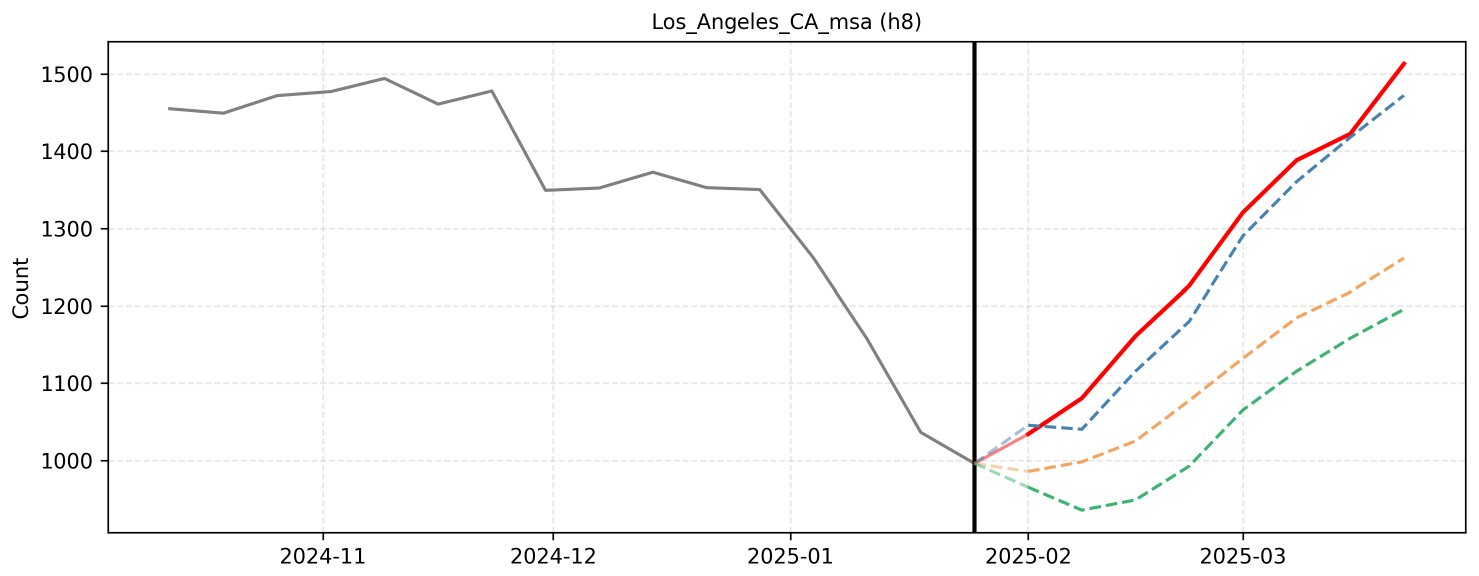
The forecast for the next eight weeks anticipates a steady recovery from the sharp declines caused by the January 2025 wildfires. As containment efforts conclude and the region transitions into February, activity levels will stabilize and begin to rise, despite a minor historical plateau often seen in the second week of the month. By March, the return of major seasonal events, milder weather, and spring break travel will drive a pronounced upward trend, closely mirroring the historical spring recovery patterns observed in previous years.
F.8 Example 8
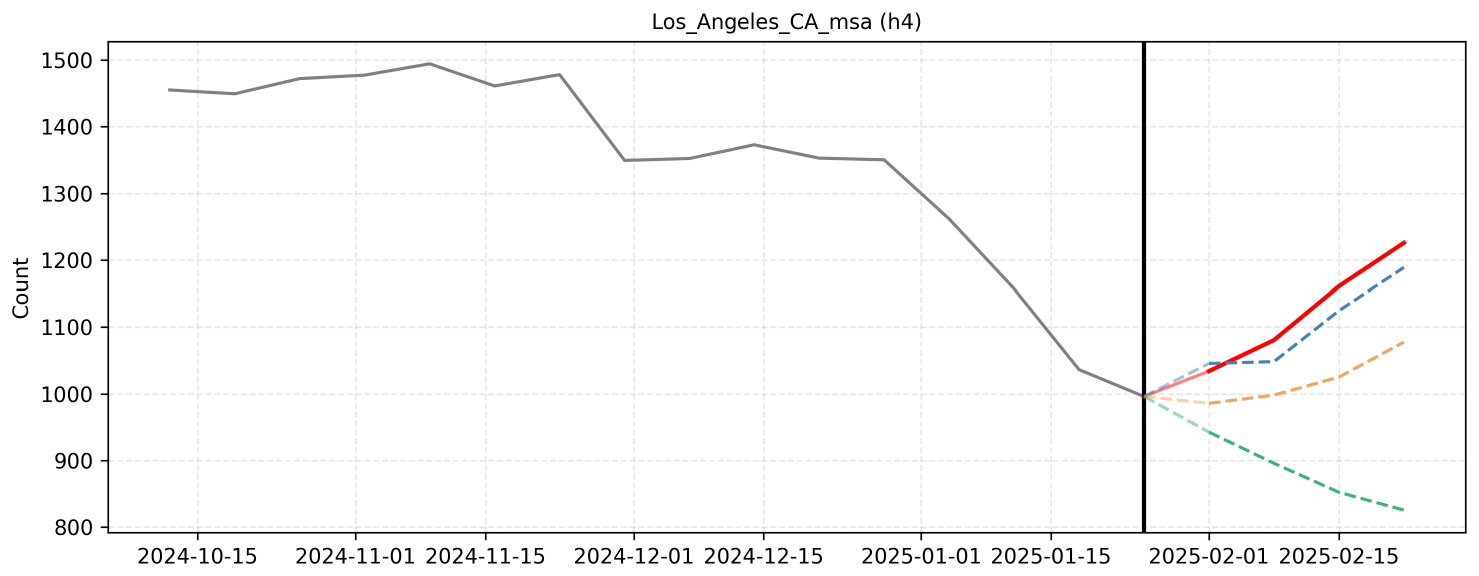
The forecast integrates the macro-level expectation of a seasonal post-January recovery with the micro-level impacts of recent regional wildfires. By analyzing historical trends from 2023 and 2024, the model anticipates an initial stabilization in early February supported by major cultural events like the Grammy Awards and Super Bowl festivities. Subsequent weeks are projected to see a stronger upward trajectory driven by holiday weekends and the resumption of postponed local activities, leading to a steady normalization of the count.
F.9 Example 9
The stock is currently experiencing a strong V-shaped recovery following a recent dip, driven by significant fundamental validations such as the Neutron Stage 2 qualification and inclusion in major defense frameworks like NSSL and EWAAC. Over the next six weeks, anticipation of strong Q1 earnings and the approaching H2 2025 window for the Neutron rocket's debut are expected to sustain this bullish momentum. By blending the macro and micro perspectives, the forecast projects a steady climb from the low \$20s back toward the mid-to-upper \$20s as market confidence is fully restored and the short-seller narrative is priced out.
F.10 Example 10
The forecast for Alphabet's stock price over the next 13 weeks integrates the overarching Macro-Reasoning of a sustained bullish trend with the granular Micro-Reasoning of specific events, earnings, and macroeconomic data releases. The stock recently closed at a high of 212.58, driven by strong Q2 GDP, cooling inflation, and the successful launch of the Pixel 10 series. Over the next quarter, the primary drivers will be Federal Reserve monetary policy, Q3 earnings, and ongoing antitrust developments. I have slightly adjusted the micro-reasoning baseline to reflect realistic weekly volatility and momentum for a mega-cap tech stock.

Step 1 (2025-09-05): The market digests the recent highs, but regulatory overhang from the anticipated DOJ antitrust remedies ruling regarding Google's search monopoly causes a slight pullback. Investors take some profits, bringing the price down to 210.45.

Step 2 (2025-09-12): Cautious positioning ahead of the upcoming FOMC meeting and the release of August CPI data leads to further consolidation. The stock dips slightly to 208.75 as the market awaits clear macroeconomic signals.

Step 3 (2025-09-19): The FOMC meeting concludes with a dovish tone and a likely interest rate cut. This accommodative stance sparks a broad rally in tech and growth stocks, allowing Alphabet to rebound strongly to 213.30.

Step 4 (2025-09-26): As Q3 comes to a close, institutional portfolio rebalancing favors mega-cap tech companies with strong AI fundamentals and robust balance sheets. The post-Fed rally continues, pushing the stock to 215.85.

Step 5 (2025-10-03): The release of the September U.S. Jobs Report introduces some mixed economic signals and labor market volatility. This causes a temporary consolidation in the broader market, with Alphabet pulling back slightly to 214.20.

Step 6 (2025-10-10): September CPI inflation data is released, showing continued cooling. This reinforces expectations for a soft landing, lifting market sentiment and tech valuations. Alphabet rallies to 217.65.

Step 7 (2025-10-17): Anticipation builds for Alphabet's Q3 2025 earnings report. Investors bid up shares based on expectations of strong Google Cloud growth and successful AI monetization from recent product launches. The price reaches 221.15.

Step 8 (2025-10-24): Alphabet releases its Q3 earnings, delivering a strong beat highlighted by robust digital ad revenue and accelerated Cloud growth. The positive financial results push the stock significantly higher to 226.40.

Step 9 (2025-10-31): Post-earnings momentum is sustained by positive analyst upgrades and end-of-month trading dynamics. The upward trajectory continues, bringing the stock to 228.50.

Step 10 (2025-11-07): The November FOMC meeting concludes, with the Fed maintaining a favorable, accommodative monetary policy. This macroeconomic backdrop continues to support tech equities, driving Alphabet to 231.25.

Step 11 (2025-11-14): October CPI data is released, showing stable inflation. Optimism surrounding Q4 holiday ad spending begins to build, leading to continued accumulation of Alphabet shares. The price increases to 233.60.

Step 12 (2025-11-21): Traditional pre-Thanksgiving market positioning takes hold. Strong consumer spending forecasts benefit Google's core advertising business, lifting the stock to 235.45.

Step 13 (2025-11-28): Black Friday retail sales and early indicators for Cyber Monday show robust e-commerce activity. This boosts expectations for Google's Q4 ad revenues, closing the forecast horizon on a high note at 238.10.
F.11 Example 11
The forecast for the next eight weeks integrates the macro-level expectation of a seasonal spring increase with the micro-level event impacts. Historical data indicates a consistent upward trend through April and May, driven by warmer weather, cultural festivals, and holidays like Cinco de Mayo and Memorial Day. While the overall baseline for 2025 is slightly lower than previous years, the anticipated seasonal momentum supports a gradual rise in the count, culminating in a peak toward the end of May.
F.12 Example 12
The forecast relies on the historical seasonal pattern observed in late February and March, where regional activity consistently increases due to spring events like the Date Festival and improving weather. While the overall baseline has shifted downward year-over-year since 2022, the seasonal upward trajectory remains intact. I have synthesized the macro-level seasonal growth trend with the micro-level event drivers to project a steady weekly increase across the four-week horizon, mirroring the historical jumps seen in previous years.
F.13 Example 13
The forecasting process for Rocket Lab (RKLB) over the next 6 weeks requires synthesizing the overarching macro-level bullish momentum with the granular, event-driven micro-level catalysts.

From a macro perspective, Rocket Lab is in a massive, sustained uptrend. Over the past year, the stock has surged from the \$11 range to over \$64, driven by a flawless launch execution record, massive contract wins (e.g., SDA, Synspective, iQPS), and the highly anticipated debut of the medium-lift Neutron rocket. Analyst price targets have recently been revised upward to the \$75–\$83 range, indicating that institutional sentiment remains highly favorable and that the market is actively pricing in future revenue growth and expanding gross margins.

From a micro perspective, the next 6 weeks are packed with specific, high-impact catalysts that will likely serve as stepping stones toward those higher analyst targets. I have adjusted the provided micro-reasoning slightly to account for realistic market mechanics, such as the fact that preliminary Q3 earnings were already released on October 3, meaning the actual earnings report on November 10 will rely more on forward guidance than revenue surprises.

Step 1 (2025-10-31): The stock saw a minor consolidation to 64.56 on October 24 after a massive run-up. As the November 5 launch window for iQPS and the November 10 earnings report approach, anticipation will drive a rebound. I forecast a steady recovery to 66.50.

Step 2 (2025-11-07): Rocket Lab's launch of'The Nation God Navigates' is scheduled for November 5. Assuming another successful deployment, combined with pre-earnings momentum, investor confidence will push the stock higher. I forecast a climb to 69.10.

Step 3 (2025-11-14): The Q3 earnings report drops on November 10. Because the record \$155M revenue and 37% gross margin were pre-announced, the market's reaction will hinge on Q4 guidance and updates regarding the Neutron rocket's H2 2025 debut. Positive forward-looking statements should trigger a breakout into the 70s. I forecast 72.80.

Step 4 (2025-11-21): Following the earnings report, financial analysts are likely to reiterate or slightly raise their price targets, reinforcing the \$75-\$83 range. This will spur institutional buying and post-earnings momentum, pushing the price to the lower bound of those targets. I forecast 75.20.

Step 5 (2025-11-28): With earnings digested, the market's focus will shift to the busy December manifest, including the dedicated JAXA launches, and end-of-year Neutron milestones. The stock will likely experience steady accumulation with minor consolidation. I forecast 76.80.

Step 6 (2025-12-05): As the year draws to a close, the combination of a record-breaking annual launch cadence and strong forward momentum will push the stock closer to the upper resistance levels of current analyst targets. I forecast 78.40.
F.14 Example 14
The forecast integrates the overarching macro perspective of Rocket Lab's strong multi-year backlog and consistent mission execution with the micro-level catalysts expected in the coming weeks. Anticipation of the Q4 2024 earnings report and subsequent analyst reactions drives initial upward momentum in the near term. Following a brief period of consolidation and natural profit-taking, the stock is projected to resume its upward trajectory as the market prices in upcoming Spring 2025 catalysts and potential new defense contract awards.
F.15 Example 15
The forecast integrates the macro-level seasonal recovery trend with micro-level event impacts, such as the Cherry Blossom Festival and Easter holidays. Historical patterns from 2022 to 2025 demonstrate a consistent annual cycle, featuring a dip in January followed by a steady climb through the spring months. By aligning these historical year-over-year growth trajectories with upcoming cultural and holiday events, the projected values reflect a gradual, event-driven increase over the 13-week horizon.
F.16 Example 16
The forecast relies on the established historical seasonal pattern where activity reaches an annual trough in late January before steadily climbing through February and March. By applying the year-over-year baseline increase observed in early 2025 to this historical growth curve, the projections reflect a consistent week-over-week rise. Key upcoming events, such as Presidents' Day weekend and the start of the National Cherry Blossom Festival, serve as the primary catalysts for the anticipated surges in activity across the 8-week horizon.
References
Section Summary: This section lists academic references on time series forecasting and analysis, drawing from conference papers and preprints. The works cover deep learning methods, transformer architectures, and foundation models that adapt language models for predicting patterns in temporal data. They range from earlier studies on efficient long-sequence modeling to recent explorations of large language models applied to forecasting tasks.
[1] G. Lai, W.-C. Chang, Y. Yang, and H. Liu. Modeling long-and short-term temporal patterns with deep neural networks. In The 41st international ACM SIGIR conference on research & development in information retrieval, pages 95–104, 2018.
[2] H. Zhou, S. Zhang, J. Peng, S. Zhang, J. Li, H. Xiong, and W. Zhang. Informer: Beyond efficient transformer for long sequence time-series forecasting. In Proceedings of the AAAI conference on artificial intelligence, volume 35, pages 11106–11115, 2021.
[3] P. Mancuso, V. Piccialli, and A. M. Sudoso. A machine learning approach for forecasting hierarchical time series. Expert Systems with Applications, 182:115102, 2021.
[4] R. Godahewa, C. Bergmeir, G. I. Webb, R. J. Hyndman, and P. Montero-Manso. Monash time series forecasting archive. arXiv preprint arXiv:2105.06643, 2021.
[5] A. Das, W. Kong, R. Sen, and Y. Zhou. A decoder-only foundation model for time-series forecasting. In R. Salakhutdinov, Z. Kolter, K. Heller, A. Weller, N. Oliver, J. Scarlett, and F. Berkenkamp, editors, Proceedings of the 41st International Conference on Machine Learning, volume 235 of Proceedings of Machine Learning Research, pages 10148–10167. PMLR, 2024. URL https://proceedings.mlr.press/v235/das24c.html.
[6] M. Goswami, K. Szafer, A. Choudhry, Y. Cai, S. Li, and A. Dubrawski. MOMENT: A family of open time-series foundation models. In R. Salakhutdinov, Z. Kolter, K. Heller, A. Weller, N. Oliver, J. Scarlett, and F. Berkenkamp, editors, Proceedings of the 41st International Conference on Machine Learning, volume 235 of Proceedings of Machine Learning Research, pages 16115–16152. PMLR, 2024. URL https://proceedings.mlr.press/v235/goswami24a.html.
[7] G. Woo, C. Liu, A. Kumar, C. Xiong, S. Savarese, and D. Sahoo. Unified training of universal time series forecasting transformers. In R. Salakhutdinov, Z. Kolter, K. Heller, A. Weller, N. Oliver, J. Scarlett, and F. Berkenkamp, editors, Proceedings of the 41st International Conference on Machine Learning, volume 235 of Proceedings of Machine Learning Research, pages 53140–53164. PMLR, 2024. URL https://proceedings.mlr.press/v235/woo24a.html.
[8] A. F. Ansari, L. Stella, C. Turkmen, X. Zhang, P. Mercado, H. Shen, O. Shchur, S. S. Rangapuram, S. P. Arango, S. Kapoor, et al. Chronos: Learning the language of time series. arXiv preprint arXiv:2403.07815, 2024.
[9] B. Cohen, E. Khwaja, Y. Doubli, S. Lemaachi, C. Lettieri, C. Masson, H. Miccinilli, E. Ramé, Q. Ren, A. Rostamizadeh, et al. This time is different: An observability perspective on time series foundation models. arXiv preprint arXiv:2505.14766, 2025.
[10] T. Zhou, P. Niu, X. Wang, , L. Sun, and R. Jin. One fits all: Power general time series analysis by pretrained lm. In Advances in Neural Information Processing Systems (NeurIPS), 2023.
[11] M. Jin, S. Wang, L. Ma, Z. Chu, J. Y. Zhang, X. Shi, P.-Y. Chen, Y. Liang, Y.-F. Li, S. Pan, and Q. Wen. Time-LLM: Time series forecasting by reprogramming large language models. In International Conference on Learning Representations, 2024a. URL https://openreview.net/forum?id=Unb5CVPtae.
[12] X. Liu, J. Hu, Y. Li, S. Diao, Y. Liang, B. Hooi, and R. Zimmermann. UniTime: A language-empowered unified model for cross-domain time series forecasting. In Proceedings of the ACM Web Conference 2024, pages 4095–4106. Association for Computing Machinery, 2024b. doi:10.1145/3589334.3645434. URL https://doi.org/10.1145/3589334.3645434.
[13] M. Tan, M. A. Merrill, V. Gupta, T. Althoff, and T. Hartvigsen. Are language models actually useful for time series forecasting? Advances in Neural Information Processing Systems, 37:60162–60191, 2024.
[14] M. Cheng, X. Tao, Q. Liu, Z. Guo, and E. Chen. Position: Beyond model-centric prediction – agentic time series forecasting. arXiv preprint arXiv:2602.01776, 2026. doi:10.48550/arXiv.2602.01776. URL https://arxiv.org/abs/2602.01776.
[15] A. R. Williams, A. Ashok, É. Marcotte, V. Zantedeschi, J. Subramanian, R. Riachi, J. Requeima, A. Lacoste, I. Rish, N. Chapados, and A. Drouin. Context is key: A benchmark for forecasting with essential textual information. In A. Singh, M. Fazel, D. Hsu, S. Lacoste-Julien, F. Berkenkamp, T. Maharaj, K. Wagstaff, and J. Zhu, editors, Proceedings of the 42nd International Conference on Machine Learning, volume 267 of Proceedings of Machine Learning Research, pages 66887–66944. PMLR, 2025. URL https://proceedings.mlr.press/v267/williams25a.html.
[16] P. Chen, Y. Wang, Y. Shu, Y. Cheng, K. Zhao, Z. Rao, L. Pan, B. Yang, and C. Guo. CC-Time: Cross-model and cross-modality time series forecasting. arXiv preprint arXiv:2508.12235, 2025. doi:10.48550/arXiv.2508.12235. URL https://arxiv.org/abs/2508.12235.
[17] F. Parker, N. Chan, C. Zhang, and K. Ghobadi. Eliciting chain-of-thought reasoning for time series analysis using reinforcement learning. arXiv preprint arXiv:2510.01116, 2025. doi:10.48550/arXiv.2510.01116. URL https://arxiv.org/abs/2510.01116.
[18] T. Kojima, S. S. Gu, M. Reid, Y. Matsuo, and Y. Iwasawa. Large language models are zero-shot reasoners. Advances in neural information processing systems, 35:22199–22213, 2022.
[19] S. S. S. Das, P. Goyal, M. Parmar, Y. Song, L. T. Le, L. Miculicich, J. Yoon, R. Zhang, H. Palangi, and T. Pfister. Synapse: Adaptive arbitration of complementary expertise in time series foundational models. arXiv preprint arXiv:2511.05460, 2025. doi:10.48550/arXiv.2511.05460. URL https://arxiv.org/abs/2511.05460.
[20] A. Garza and R. Rosillo. Timecopilot. arXiv preprint arXiv:2509.00616, 2025. doi:10.48550/arXiv.2509.00616. URL https://arxiv.org/abs/2509.00616.
[21] X. Tao, M. Cheng, C. Jiang, T. Gao, H. Zhang, and Y. Liu. Cast-r1: Learning tool-augmented sequential decision policies for time series forecasting. arXiv preprint arXiv:2602.13802, 2026. doi:10.48550/arXiv.2602.13802. URL https://arxiv.org/abs/2602.13802.
[22] Google DeepMind. Gemini 3.1 pro model card. Technical report, Google, 2026. URL https://storage.googleapis.com/deepmind-media/Model-Cards/Gemini-3-1-Pro-Model-Card.pdf.
[23] Anthropic. System card:claude sonnet 4.5. Technical report, Anthropic, 2025. URL https://www-cdn.anthropic.com/963373e433e489a87a10c823c52a0a013e9172dd.pdf.
[24] N. F. Liu, K. Lin, J. Hewitt, A. Paranjape, M. Bevilacqua, F. Petroni, and P. Liang. Lost in the middle: How language models use long contexts. Transactions of the association for computational linguistics, 12:157–173, 2024a.
[25] N. Gruver, M. Finzi, S. Qiu, and A. G. Wilson. Large language models are zero-shot time series forecasters. Advances in neural information processing systems, 36:19622–19635, 2023.
[26] M. A. Ahamed, M. Parmar, P. Goyal, Y. Song, L. T. Le, Q. Cheng, C.-L. Li, H. Palangi, J. Yoon, and T. Pfister. Tfrbench: A reasoning benchmark for evaluating forecasting systems. arXiv preprint arXiv:2604.05364, 2026.
[27] K. Vodrahalli, S. Ontanon, N. Tripuraneni, K. Xu, S. Jain, R. Shivanna, J. Hui, N. Dikkala, M. Kazemi, B. Fatemi, et al. Michelangelo: Long context evaluations beyond haystacks via latent structure queries. arXiv preprint arXiv:2409.12640, 2024.
[28] X. Zhang, R. R. Chowdhury, R. K. Gupta, and J. Shang. Large language models for time series: A survey. In K. Larson, editor, Proceedings of the Thirty-Third International Joint Conference on Artificial Intelligence, IJCAI-24, pages 8335–8343. International Joint Conferences on Artificial Intelligence Organization, Aug. 2024. doi:10.24963/ijcai.2024/921. URL https://doi.org/10.24963/ijcai.2024/921. Survey Track.
[29] D. Cao, F. Jia, S. O. Arik, T. Pfister, Y. Zheng, W. Ye, and Y. Liu. TEMPO: Prompt-based generative pre-trained transformer for time series forecasting. In The Twelfth International Conference on Learning Representations, 2024. URL https://openreview.net/forum?id=YH5w12OUuU.
[30] M. Jin, S. Wang, L. Ma, Z. Chu, J. Y. Zhang, X. Shi, P.-Y. Chen, Y. Liang, Y.-F. Li, S. Pan, and Q. Wen. Time-LLM: Time series forecasting by reprogramming large language models. In The Twelfth International Conference on Learning Representations, 2024b. URL https://openreview.net/forum?id=Unb5CVPtae.
[31] K. Rasul, A. Ashok, A. R. Williams, H. Ghonia, R. Bhagwatkar, A. Khorasani, M. J. Darvishi Bayazi, G. Adamopoulos, R. Riachi, N. Hassen, M. Biloš, S. Garg, A. Schneider, N. Chapados, A. Drouin, V. Zantedeschi, Y. Nevmyvaka, and I. Rish. Lag-Llama: Towards foundation models for probabilistic time series forecasting. arXiv preprint arXiv:2310.08278, 2023. doi:10.48550/arXiv.2310.08278. URL https://arxiv.org/abs/2310.08278.
[32] J. You, J. Yang, Y. Xie, Z. Wu, X. Li, F. Li, P. Wang, J. Xu, B. Zheng, and X. Chen. LoFT-LLM: Low-frequency time-series forecasting with large language models. arXiv preprint arXiv:2512.20002, 2025. doi:10.48550/arXiv.2512.20002. URL https://arxiv.org/abs/2512.20002.
[33] S. Guo, B. Wang, S. Zhang, and F. Shen. T-LLM: Teaching large language models to forecast time series via temporal distillation. arXiv preprint arXiv:2602.01937, 2026. doi:10.48550/arXiv.2602.01937. URL https://arxiv.org/abs/2602.01937.
[34] F. Zhang, S. Fan, and H. Wang. TimeSAF: Towards LLM-guided semantic asynchronous fusion for time series forecasting. arXiv preprint arXiv:2604.12648, 2026. doi:10.48550/arXiv.2604.12648. URL https://arxiv.org/abs/2604.12648.
[35] H. Zhao, X. Zhang, J. Wei, Y. Xu, Y. He, S. Sun, and C. You. Timeseriesscientist: A general-purpose ai agent for time series analysis. arXiv preprint arXiv:2510.01538, 2025. doi:10.48550/arXiv.2510.01538. URL https://arxiv.org/abs/2510.01538.
[36] X. Zhang, T. Gao, M. Cheng, B. Pan, Z. Guo, Y. Liu, X. Tao, and Q. Liu. Alphacast: A human wisdom-llm intelligence co-reasoning framework for interactive time series forecasting. arXiv preprint arXiv:2511.08947, 2025. doi:10.48550/arXiv.2511.08947. URL https://arxiv.org/abs/2511.08947.
[37] P. Villalobos, A. Ho, J. Sevilla, T. Besiroglu, L. Heim, and M. Hobbhahn. Will we run out of data? limits of llm scaling based on human-generated data, 2024.